When you get a design just right, user experience (UX) can feel like a treat for visitors.
Right from the first impressions all the way to completing the purchase process, by hitting the right balance of features and functionalities in your UX, you’ll leave them feeling successful and delighted – and this feeling will compel them to keep coming back for more!
Brand affinity can be won if customers can easily perform the task they visited your site to do, they enjoy the look and feel of your site, and there are small moments of delight (i.e. success messages and subtle interaction design). With brand affinity, your customers will return to your site, engage in more of your products, and tell their friends, family, and colleagues about your brand.
A satisfying customer experience is the end goal of data-driven design.
A small note: We have used the term ‘data-driven design’ here because it is the blanket term for the process of using data to make UX design decisions. We highly recommend following the ‘data-aware’ approach to design. We will discuss the difference in the third section of this blog.
Is your UX as functional as it is appealing to your users’ eye?
Design is not just what it looks like and feels like. Design is how it works. – Steve Jobs
More often than not, the reason behind a website looking great but not performing very well is that UX designers may not be able to fully understand the needs and goals of the customers of your product or service, despite their best efforts to do so. Data is highly helpful in filling the knowledge gap of designers.
Besides time constraints and the need to get to market quickly without time for proper research, designers often make design decisions based on business goals, aesthetic appeal, personal opinion (their own or stakeholders’), and copying the experiences from other websites.
While the look and feel of a website will affect the customers’ (the umbrella term for end-users) opinion of your brand, the ability to perform their desired task is ultimately more important than how the site looks. (If they can’t perform the task they were hoping to perform, they will leave your site (sometimes frustrated) and try to find another site or solution.)
So how do you design your UX to give customers the most satisfying experience?
To deliver a delightful user experience that keeps your customers happy and returning, you’ll need to base your design decisions on one important thing: “actionable data”.
No wonder then that Apple continues to be the world’s most valuable publicly traded company. It is through the measurement of past customer behavior and their strong focus on a simple clean esthetic and a unique user experience – which, in turn, is based on both: powerful branding, understanding of layout, information hierarchy, and quantification.
For example, their website is continually driven by minimalism and contrasting sections (to differentiate between their product categories). These design aspects focus the visitor’s attention on the products showcased in high-quality images. Further, the minimalism draws their attention to the very prominent calls-to-action, enticing them to “learn more” or “view pricing”.
If we scroll down the home page, the use of these two factors is even more clearly evident:
This unwavering focus on design (backed by years of UX research) is what makes the Apple experience uniquely attractive, hooking customers’ attention, and helping them perform their tasks!
Designing a great customer experience that is based on data involves gathering user feedback, A/B testing, website optimization analytics, and many more sources of data points that have a direct bearing on customer satisfaction (CSAT).
Getting Started With Data-Driven Design
Data-driven design (DDD) means that the design process is backed by qualitative and quantitative data. Whether it is developing new designs or improving your existing designs, data makes both processes more objective.
Ideally, the end goals of both these processes should be to reduce customers’ pain points. Even if a website looks great, if it does not solve the customers’ needs, they are less likely to return to your site. The data-driven design avoids this pitfall by objectively measuring the effect of every design choice through user testing, customer surveys, site analytics, and consumer research.
In this blog, we will go over the finer points of data-driven design:
- How to Improve UX Based on Data & Feedback
- Why Data Analytics is Essential for UX Design
- Differences Between Data-Driven, Data-Informed, and Data-Aware Design
- Qualitative & Quantitative UX Research Methods
- Tools to Kickstart Data-Driven Design
- Real-life Examples & Case Study
Related Read: 16 Best UX/UX Design Tools
How To Improve UX Based on Data & Feedback
Data guides the design process by measuring what works and what doesn’t. Users give their feedback about their experience, which helps identify the parts of their experience that are working and which ones are not. Using this data, you can improve the more challenging areas and (time and resources permitting) refine the good ones.
Data from sources such as customer satisfaction (CSAT) surveys, customer lifetime-value approximation, website metrics, social media engagement, customer churn, sales channels’ effectiveness, and customer acquisition analytics contributes highly to designing better UX.
Here’s a basic example of using customer feedback for contributing to better content:

To give you another example of implementing the data-driven design in your UX: Suppose you are considering two different layouts for your mobile website pages. For best results, you need to do split testing, AKA A/B testing. In this UX research method, ‘A’ and ‘B’ are the two different site layouts.
You will need to test the effectiveness of both on similar user groups. Whichever performs better with the test groups should be the final site layout for your mobile website.
{Tip: Keep your long-term goals in mind while deciding how to use data-driven design.}
There is no limit to what part of your UX you can test by collecting relevant, contextual data.
Bonus: Using Surveys to Design the Perfect Prototype
In-context surveys let you capture user insights (without annoying testers/users) at every stage of designing the prototype of your product. In fact, integrating surveys doesn’t mean you need to bug developers. All you need is a URL to get started with designing products people will love!
Related Read: 30 Best Website Feedback Tools
Why Data Analytics Is Essential For UX Design
Testing is ideally followed up by analyzing the data and feedback. Analyzed data help to iterate and improve the user experience. Analytics tools fall into various categories, and your product’s characteristics decide which category (or categories) of tools you need to use to improve UX.
Major categories of analytics tools are:
- Real-time usage analytics
- Website/web page analytics
- Session recording software, such as Fullstory
- Heatmap/click map analytics, such as SessionCam
The analysis of data gained through these tools helps in the following ways:
- recreating the customer journey more accurately
- identifying reasons behind exit intent
- increasing conversion rates
- fine-tuning design elements and content
Creating a good UX is helped along with data, right from building user personas all the way through to developing product features that will be most helpful and attractive to those users.
Here are a few areas in which data-driven design is quite useful:
- Creating more accurate user personas
- Designing better product features
- Improving existing user experience
- Analyzing the whole customer journey
Generally, data-driven design can improve everything, but only when it is feasible. No matter what data tells you, hold back from overhauling too many things in your UX design too often.
Let’s look at the distinction between:
- relying entirely on data,
- using data to arrive at specific solutions, and
- considering general data for developing a user-friendly design.
Data-Driven vs. Data-Informed vs. Data-Aware Design
Designing your UX based on data involves user feedback and surveying, A/B testing, website analytics, and consumer research, as we’ve said earlier. With so many different answers to the overarching question “, what is data-driven design” it is best to be conscious of the distinctions between Data-Driven Design, Data-Informed Design, and Data-Aware Design.
When you use only quantitative data that tells you what a customer did on your site without the “why,” you may miss out on making the user experience more engaging.
- Being “data-driven” while designing the UX means relying almost entirely on data-backed decisions. ETL tools can be a key factor for analytics to unify data to a single record to help guide decisions.
- Being “data-informed” relates most closely to the combination of statistical data with experience or intuition. Design processes that rely heavily on structured A/B testing and usability tests can be called data-informed.
- Being “data-aware” is the broadest approach towards design while taking data into account. It is best used while dealing with design challenges one-by-one, instead of going for massive redesigns and overhauls. This approach is focused on cherry-picking the data collection and analysis processes to best suit the purpose of improving your UX.
The common thread in all these processes, of course, is data.
We recommend adopting a holistic view of your UX design process and using data where it will be the most beneficial. Deciding where to rely on data to improve existing processes or to design new ones can be tricky, but with some practice and constructive discussion with your design team, it’s worth it.
Now, how do we go about collecting data that will be beneficial to our design processes?
Related Read: Read this Ultimate Guide & see how well UX & SEO go together!
FREE. All Features. FOREVER!
Try our Forever FREE account with all premium features!
UX Data Collection Techniques – Qualitative & Quantitative
The amount of data you collect is not as important as its quality. The first step is to identify what design data you need, which is determined by the purpose of collecting the data and selecting UX research methods that will deliver relevant, actionable data for improving a part of your UX.
For example, are you looking to redesign your landing pages? Or do you want to test different placements of your call to action (CTA) elements? Every element of UX can benefit from UX research methods like usability testing, behavior flows, and A/B testing, among many others.
Once you decide the kind of data you need, it is time to think about the method/process through which you will collect that data. The UX research method should be best suited to your intent.
Now that you know how to ask, the next step is to ask the right question to the right person.
For data-driven design to be successful, the data collection process should target the most relevant user groups to understand how your product or service is being used, understood, and interacted with.
Data can be collected at every stage of the design process, right from the prototype stage.
Here are a few examples of data collection techniques for quantitative (numerical) and qualitative (non-numerical) data:
Quantitative:
- Google Analytics & other metric providers count these numbers for you:
- Visit counts by URL
- Traffic sources
- Click-through rate
- Bounce rate
- Navigation paths
- Pages viewed
- Time spent on page
- Heat (attention) maps
Qualitative
- User feedback & customer surveys give you uncountable data through:
- In-context questions
- Open-ended questions
- Pop-up email capture forms
- Customer support database
- In-person interviews
- Competitor analysis
You can collect valuable data by examining your site flow to catch any pain points. Where are customers getting stuck on their journey? This is also a good way to validate your customer journey map as well as your customer personas.
ALSO SEE: How To Use Qualitative & Quantitative Data To Defend Your Design Decisions
Another (often overlooked) point to identify gaps in your data-driven systems is to explore what your average visitor’s journey looks like from a starting point that isn’t your landing page to see if visitors reach the ‘proper’ or ideal page as intuitively as possible.
So what are the tools you’ll need to make the most of this information about data-driven design? Let us point you towards a few tools to kickstart your data-driven design process.
Related Read: Best Usability Testing Tools
Tools To Kickstart DDD For Your Business
- Google Analytics to see what’s happening
- Qualaroo for continuous design improvement through feedback and surveys
- User Testing for first-person reactions via video
- Email on Acid for email-based testing
- Attention Wizard to see attention heat maps
Case Study & Real-Life Examples
Case studies and real-life examples are a great way to show the practical advantages gained through data-driven UX research and design.
- In 2014, the airline Virgin America carried out A/B testing to redesign a newer, more responsive website.
Result: The new website led to a 14% increase in conversion rates, as well as a reduction in support calls by 20%. Another happy outcome was that they noted that bookings took place twice as fast across devices.
- The e-commerce website Music & Arts wanted to redesign its website, so they employed usability testing and heuristic evaluation to make their decisions.
Result: This project resulted in an increase of about 30% YoY in their online sales.
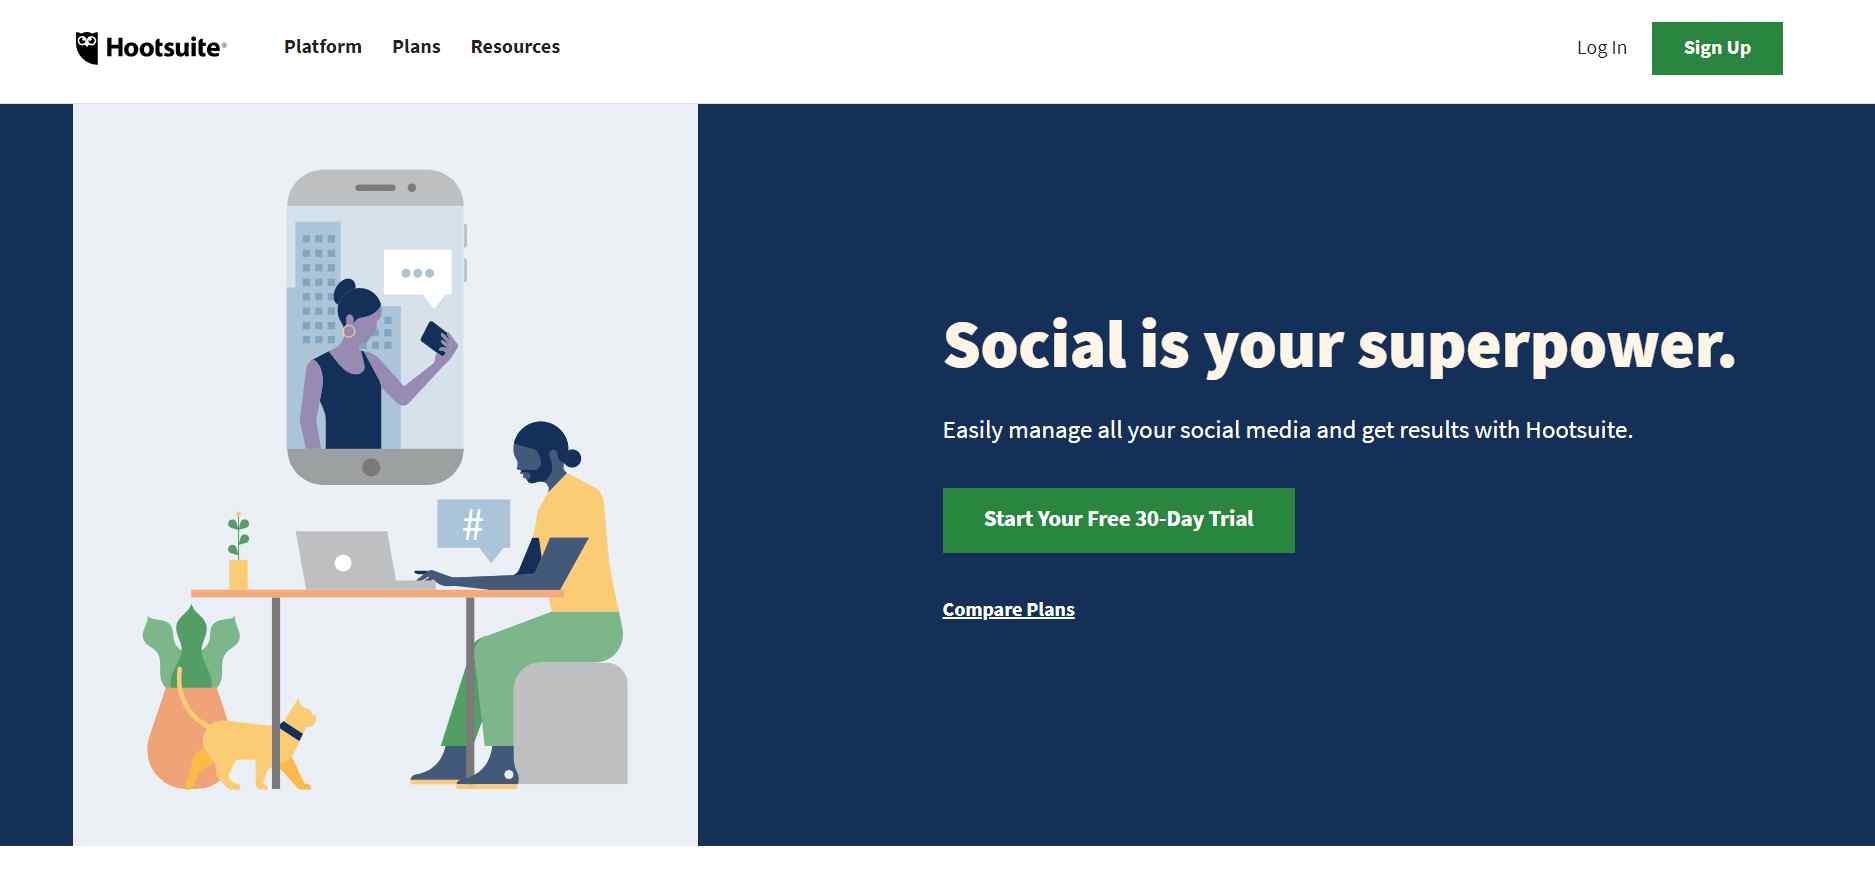
- Hootsuite used Qualaroo to test their branded landing pages.
Result: They gained a 16% lift in conversion at 98% statistical significance. Read this detailed case study to know in detail.
Draw In The Crowds With Data-Driven Design
While intuition does play an important part in UX design, data is what proves or disproves any hypothesis about the design’s effectiveness.
With the right data from customers, you and your team can create delightful UX designs that combine functionality, beauty, and business goals.
When you make decisions about UX based on data-driven design, your website has a better chance of whetting your buyers’ appetites for your product or service! Treat them to an awesome user experience and leave them with a satisfying feeling that makes them staunch patrons of your brand!
FREE. All Features. FOREVER!
Try our Forever FREE account with all premium features!
 We'd love your feedback!
What did you like & how can we make it even better?
 Thanks for your feedback!
 Ask Your Question
Have a question? Get expert help to make your decision easier.