
You already have a customer feedback management process. You send surveys, responses come in, and someone exports the data to a spreadsheet. That part works.
What does not work is everything that happens next. The spreadsheet sits untouched for two weeks. Product and support disagree on whose queue it belongs in.
Customers who gave feedback never hear anything changed. And churn keeps moving in the wrong direction.
The problem is not the collection. It is the system, or the absence of one.
This guide is for teams who have moved past the “should we collect feedback” question and are stuck on “why is our feedback not changing anything.”
Here is how to diagnose where your customer feedback management system breaks down and rebuild it.
What Is Customer Feedback Management, and Why Does It Matter?
Customer feedback management (CFM) is the systematic process of collecting, analyzing, and acting on customer feedback to improve products, services, and experiences. CFM uses various channels and tools to gather insights, identify trends, and make data-driven decisions that enhance customer satisfaction.
The operative word is systematic. A one-off survey is not a feedback management system. A Slack message with a customer complaint forwarded to a product manager is not one either.
A system is what happens when feedback is collected across channels, routed to the right teams, acted on with evidence, and followed up so customers know their input changed something.
A 2026 Zendesk study states that one unresolved issue now costs brands a customer for life. And, 83% of consumers believe customer experience should be far better than it is today.
According to Salesforce research, 65% of customers expect companies to adapt to their changing needs and preferences.
Another 2024 Forrester research study found that companies that put customer experience at the center of their strategy achieve 49% faster profit growth and 51% better customer retention than their peers.
If you are not building ways to hear from customers before they decide to go, you are managing outcomes instead of preventing them.
What Does a Working Customer Feedback System Actually Look Like?
A working system has five connected stages. Each one feeds the next. Skip one, and the chain breaks.
Stage 1: Collect Feedback in Context, Not After the Fact
The most common collection mistake is timing. Emailing a survey three days after a user cancels does not tell you why they left. It tells you how they feel about having left.
By then, the insight is retrospective, and the customer is already gone.
In-context collection asks users while they are actively engaged, at the exact moment of friction or decision.
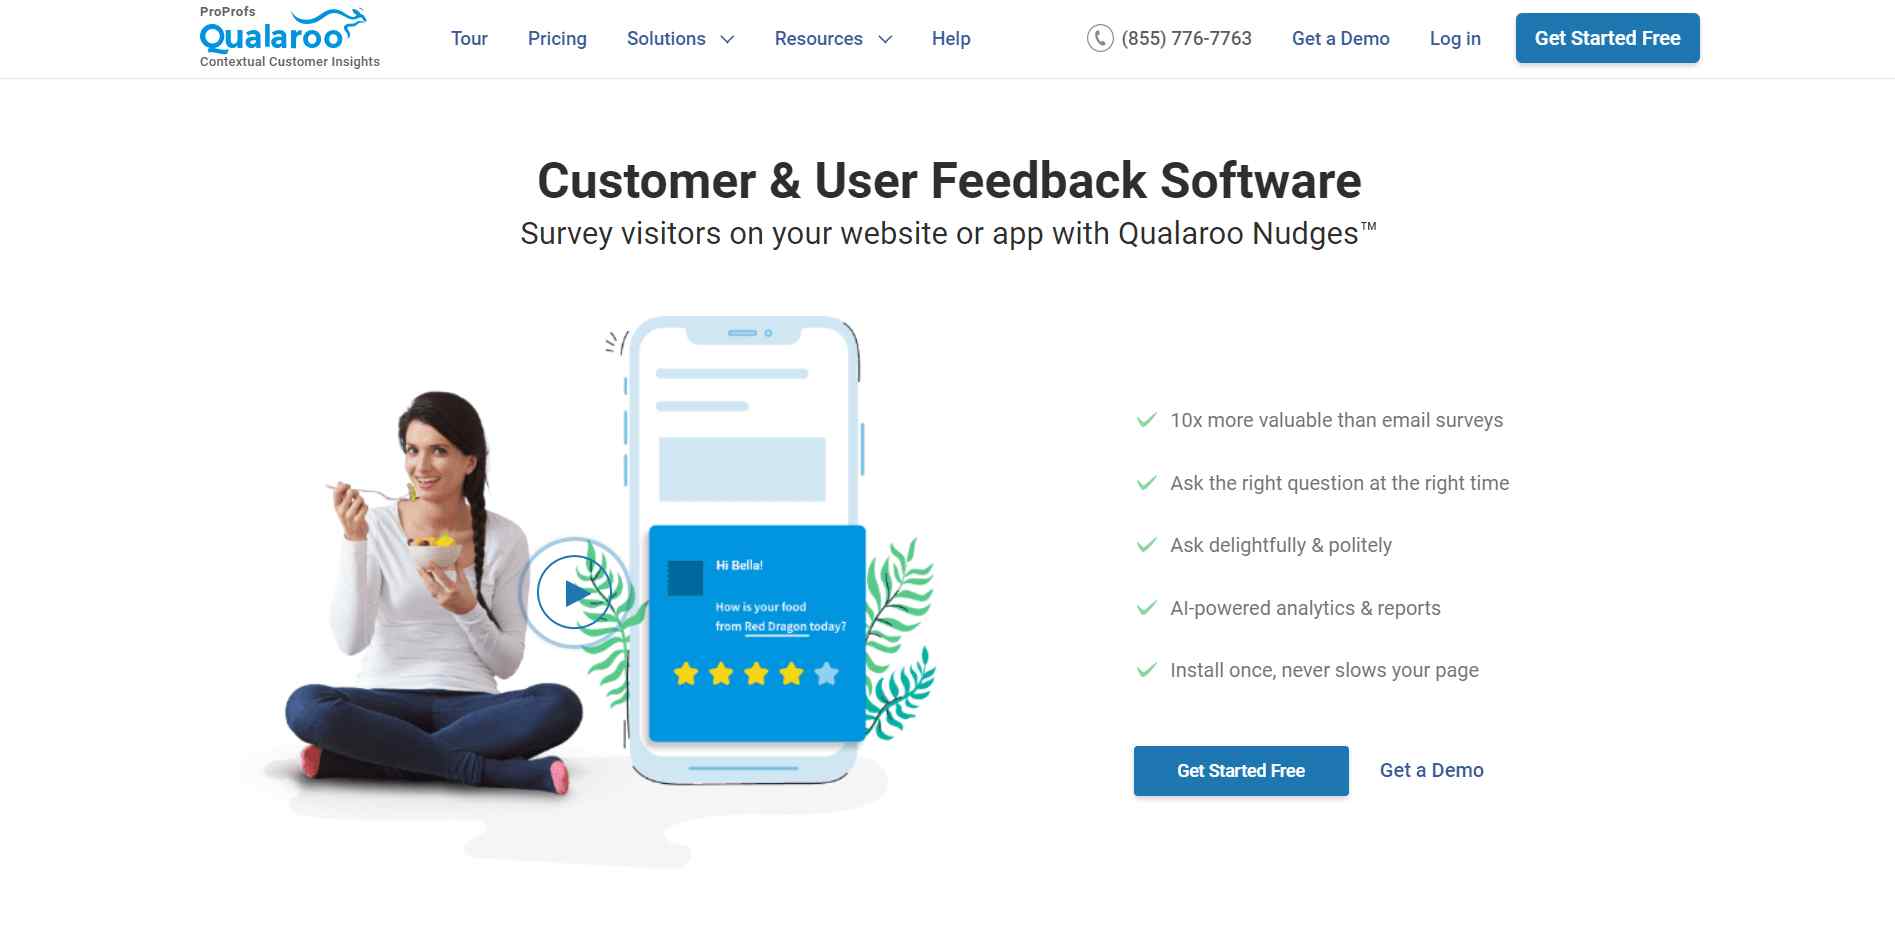
That is where Qualaroo’s Nudge™ technology comes in. A Nudge is a non-intrusive, behavior-triggered micro-survey that appears directly on your site or inside your app, asking one focused question at the moment it matters most.
No page reload, no separate survey link, no email delay.
Here is exactly how to set up your first Nudge from scratch:
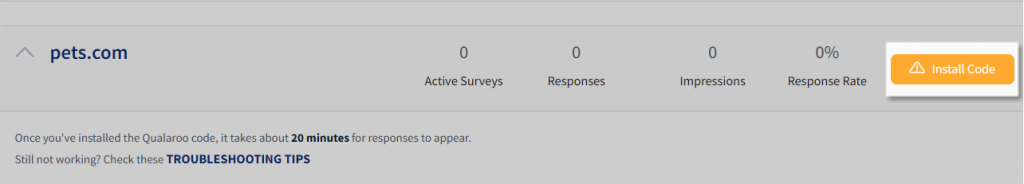
Step 1: Install the Code (Once)
Log in to your Qualaroo dashboard. Navigate to your domain and select “Install Code.”
Copy the lightweight JavaScript snippet and paste it into your website’s source code just before the closing </body> tag, or add it via Google Tag Manager if you prefer a no-code route.
This is a one-time setup. The code runs asynchronously, so it does not affect page load speed.
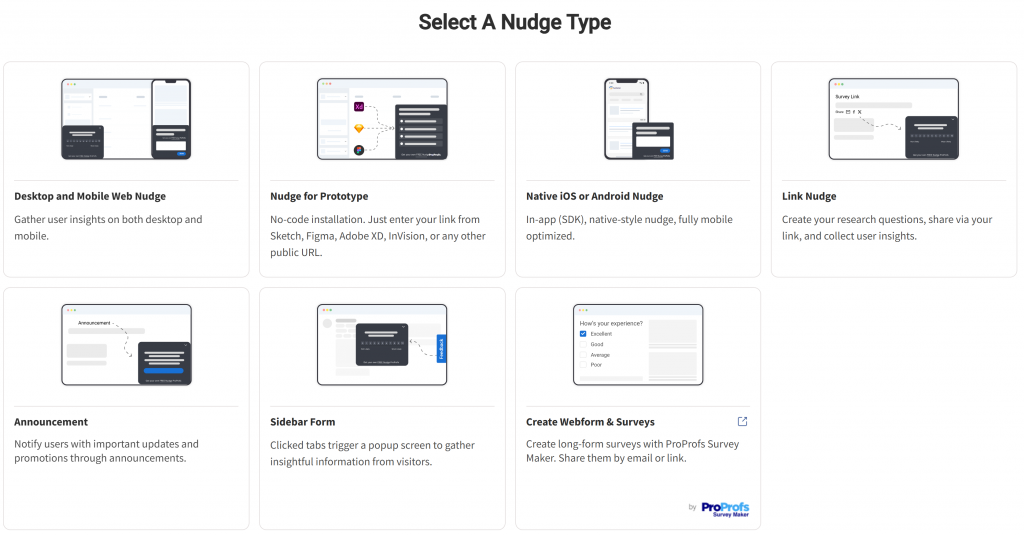
Step 2: Create a New Nudge
From the dashboard, click “Create a Nudge.”

Then, select your channel type. If you are targeting mobile app users, select the Desktop and Mobile Web Nudge and follow the SDK integration steps.
Give the Nudge a name that identifies the friction point it is measuring, for example, “Checkout Exit – Q2 2026.”

Step 3: Choose Your Question Type and Write Your Question
In the Nudge editor, you will see a preset question and a message screen. Edit the question to match your specific goal.
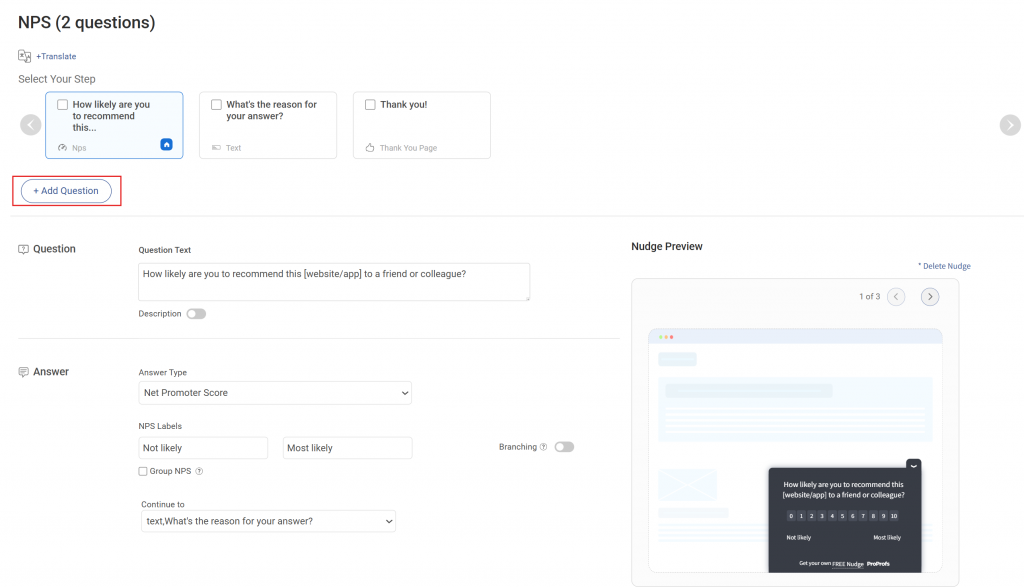
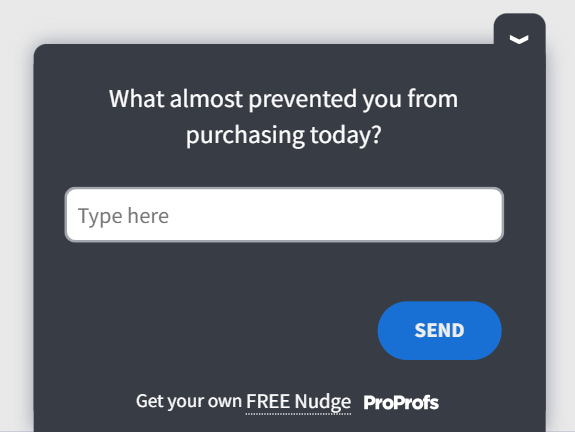
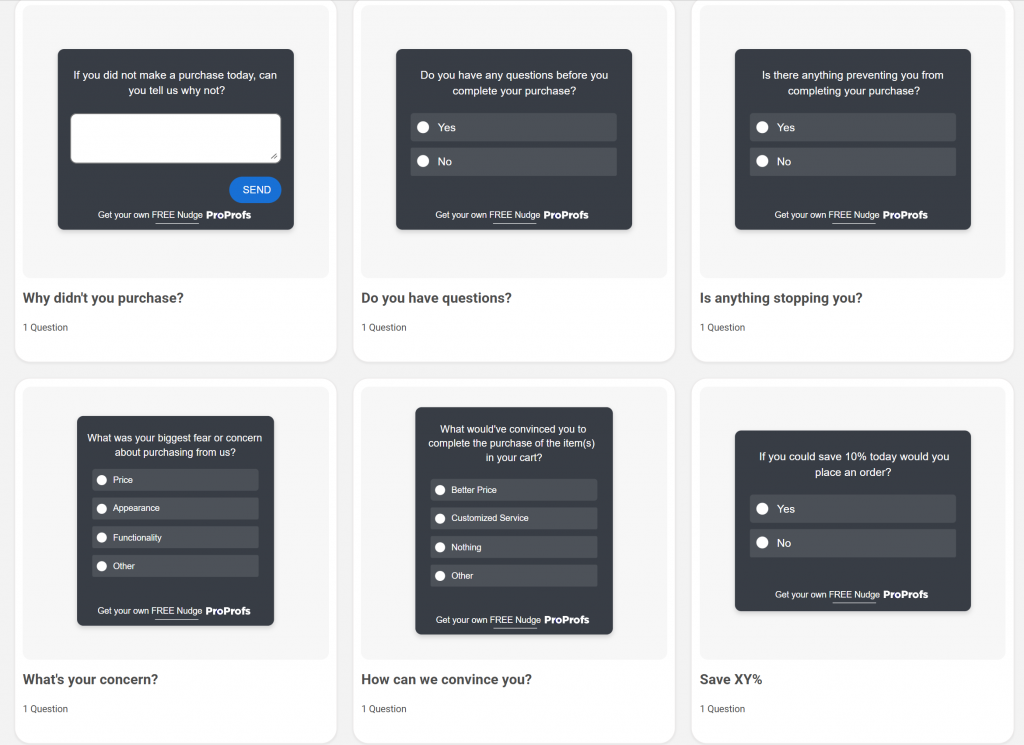
For an exit intent survey on a checkout page, use a multiple-choice question with a follow-up open-text branch.
today?” Answer options: Pricing concerns / Wasn’t ready to buy / Couldn’t find what I needed / Technical issue / Other
Branch for “Technical issue”: “Can you describe what happened?” (open text)
Use this post-purchase template for this particular example:
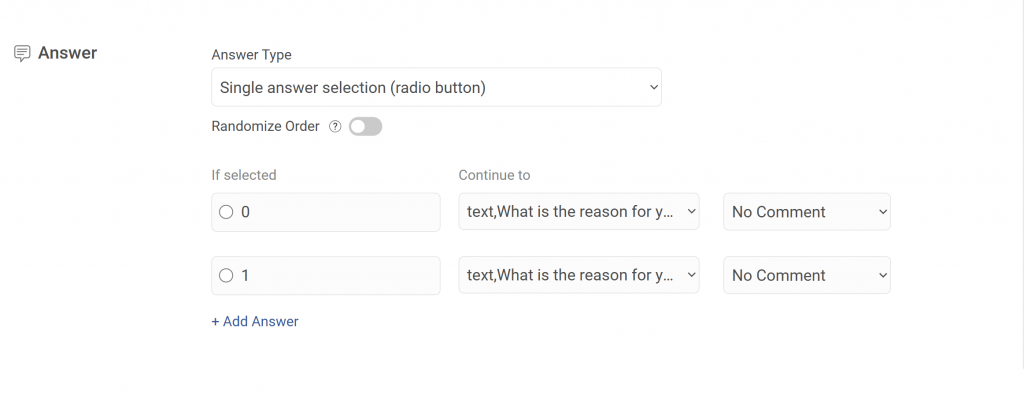
Use branching logic to route follow-up questions based on the selected answer. This keeps the survey short for most users while collecting richer detail from the segments where you need it most.
Step 4: Set Your Targeting Rules
Navigate to the Targeting tab. This is where you define who sees the Nudge, on which page, and under what conditions. Key targeting options:
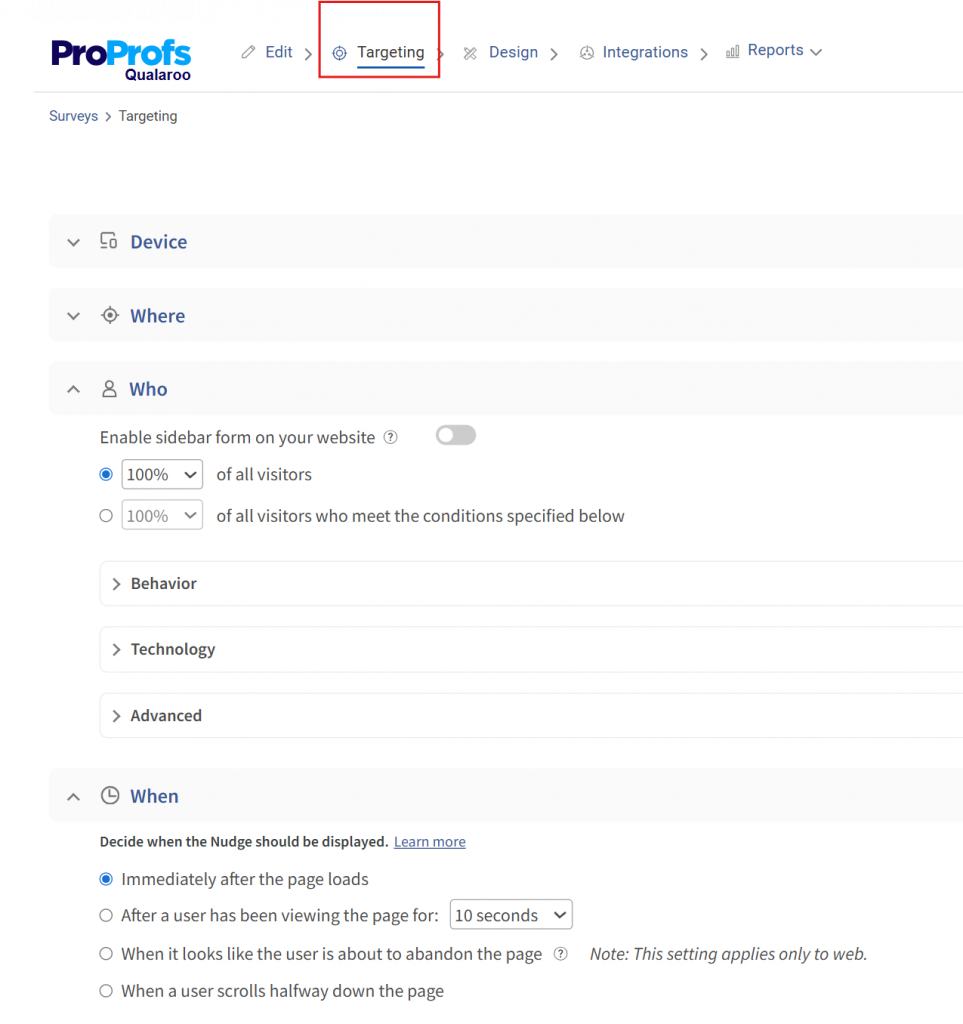
- URL targeting: Restrict the Nudge to your checkout page, pricing page, or a specific app screen
- Exit intent: Trigger the Nudge only when the cursor moves toward the browser’s close button or back arrow
- Time on page: Show the survey after a user has spent 30 or 60 seconds on the page, filtering out accidental visits
- User identity: Target logged-in users by plan tier, account age, or any custom property passed via Qualaroo’s Identity API. For example, show the survey only to users on a free trial who have visited the upgrade page more than twice.
- Visit history: Exclude users who have already responded to avoid repeat prompts
Set an expiration or response limit if the survey is tied to a specific campaign window.
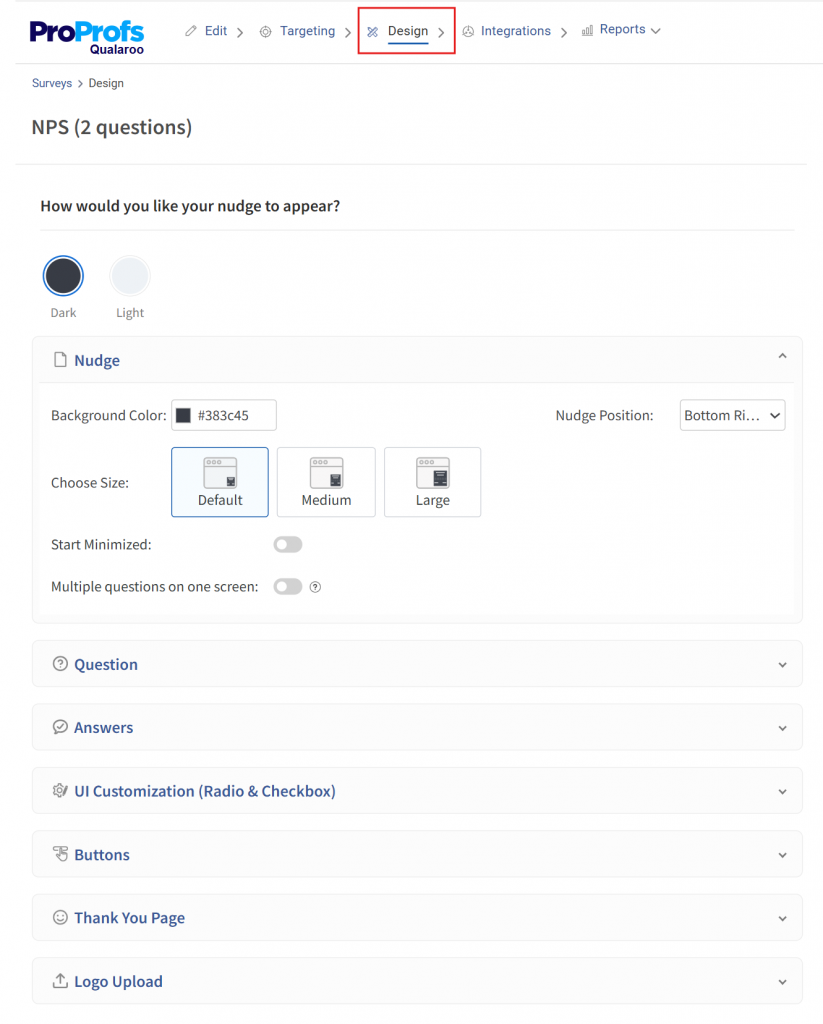
Step 5: Customize the Design
In the Design tab, match the Nudge to your brand. Update the color scheme, font, and logo so it feels native to your product rather than a third-party widget.
Set the display position (bottom left, bottom right, or center) and choose whether it launches in minimized or expanded state.
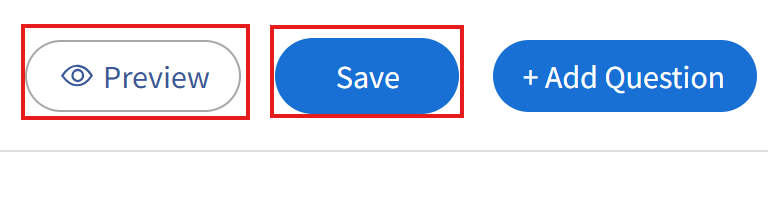
Step 6: Activate and Monitor
Save and activate the Nudge. Responses start appearing in your Qualaroo reporting dashboard in real time.
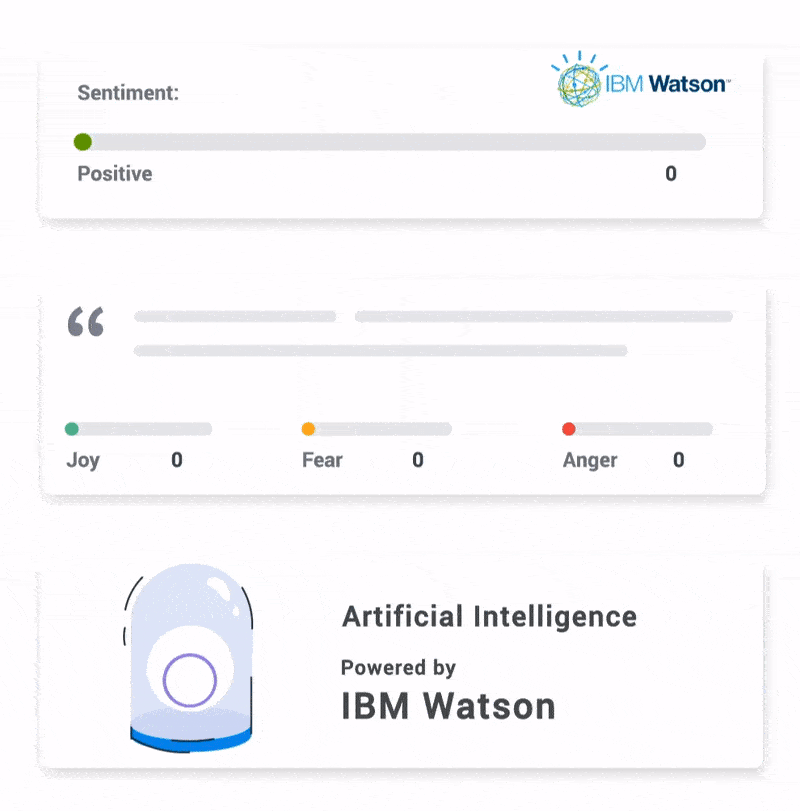
Use the AI-powered sentiment analysis to automatically categorize open-text responses by theme and sentiment, so you are not manually reading every answer to find the pattern.
Qualaroo’s free plan includes all features for up to 50 responses, which is enough to run your first in-context survey, validate the approach, and generate your first round of actionable insight before committing to a paid tier.
The full setup, from code install to first live Nudge, takes under an hour without developer involvement for the web version.
Here is a ready-to-use question set for the five highest-value trigger points:
| Trigger Point | Question | Question Type |
|---|---|---|
| Checkout exit | "What stopped you from completing your purchase today?" | Multiple choice + open text branch |
| Post-onboarding | "What nearly stopped you from signing up?" | Open text |
| Post-support interaction | "Did we fully resolve your issue?" | Binary + open text if No |
| In-app after 30 days | "What is the one thing you wish we did better?" | Open text |
| Pricing page exit | "Was anything unclear about our pricing?" | Binary + open text if Yes |
Here are a few sales and leads templates you can use:
Belron, the parent company of Safelite and Autoglass, used Qualaroo’s exit-intent surveys and sentiment analysis to catch mid-journey friction that customers had already forgotten by the time post-visit surveys went out.

The insight revealed that different customer segments were navigating different journeys through the site. Adjusting the experience by segment reduced bounce rate and improved conversions.
Stage 2: Tag and Filter Before Analysis
Raw responses are not insights. One complaint about a UI element is noise. Thirty users saying they cannot find the payment confirmation screen is a pattern worth fixing this sprint.
Tag every response as it comes in using at least four categories: product or feature issues, pricing or value concerns, UX or navigation friction, and feature requests.
Within each category, filter by customer segment. A complaint from a high-value enterprise account carries more weight than the same issue from a trial user who never converted.
Centralizing feedback from surveys, support tickets, reviews, social media, and live chat only produces a usable dataset if everything is tagged with the same taxonomy. Without a shared tagging system, product feedback and support feedback about the same issue carry different labels and never surface as a unified pattern.
A working taxonomy has three levels:
- Theme (the broad category, such as Onboarding, Pricing, or Performance),
- Sub-theme (the specific issue within that category, such as Plan comparison clarity or Feature discovery in onboarding)
- Source (the channel the feedback came from, such as in-app Nudge, support ticket, or review site).
Two Rules That Keep the Taxonomy Usable Over Time: Limit the number of top-level themes to 8 to 12, and designate one person as the taxonomy owner who merges duplicate tags, resolves labeling conflicts, and maintains a tag dictionary that all analysts reference.
Tag sprawl, where every analyst creates new tags to describe adjacent issues, is the most common cause of centralized feedback becoming as hard to interpret as scattered feedback.
Also note that structured data (scale scores, ratings, multiple-choice responses) and unstructured data (open-text responses, review comments, support ticket text) require different processing pipelines.
Structured data can be trended and compared directly. Unstructured data needs coding, NLP, or AI-assisted analysis before it is comparable. Treat them as parallel inputs that inform each other, not interchangeable data types that can be averaged together.
Qualaroo’s AI sentiment analysis handles this automatically for open-text responses, classifying by theme and tone so the path from “collected” to “understood” takes minutes instead of days.
Stage 3: Prioritize by Impact, Not Volume
High volume does not mean high priority. Use this matrix to cut through competing requests:
| Impact | Effort | Action |
|---|---|---|
| High | Low | Fix immediately, this sprint |
| High | High | Plan and resource strategically, next quarter |
| Low | Low | Backlog, revisit quarterly |
| Low | High | Remove from the queue entirely |
The impact-effort matrix is a starting point. Two additional frameworks that sharpen prioritization decisions:
Frequency × Severity Scoring: Score each feedback theme on two dimensions: how often it appears across all channels, and how severe the consequence is for the customer (measured as churn risk, support escalation rate, or satisfaction drop). Multiply the two scores to produce a priority rank. A theme that appears in 8% of responses but consistently precedes churn outranks a theme that appears in 25% of responses with no detectable outcome correlation.
Validation Against Behavioral and Operational Data: A feedback theme should be cross-referenced with observable data before it drives a significant resource commitment. If customers report that the onboarding flow is confusing, check the product analytics to see whether drop-off at the onboarding step matches the frequency of that complaint.
If the behavioral data confirms the friction, the theme is validated. If the behavioral data shows no drop-off, the problem may be a perception issue rather than a usability one, which requires a different fix.
Apply one filter before the matrix: Does this feedback connect to a KPI leadership track? If it does not move churn rate, conversion rate, CSAT, or NPS, it is a nice-to-have regardless of volume.
Stage 4: Route Insights to the Team That Can Act
Build routing rules at setup, not after the fact. Detractor scores go to customer success via Slack. Feature request themes go to the product backlog in Asana or Jira.
UX friction data goes to the design queue.
Qualaroo’s native integrations with Slack, Salesforce, HubSpot, and Zapier let you configure these routing rules directly from the survey dashboard, so the signal reaches the right person without manual forwarding.
When routing is automatic, nothing waits for a Monday morning review.
Stage 5: Close the Loop and Measure the Outcome
Every feedback-driven change needs a follow-up. Not because it is polite, but because it is how you keep customers willing to give feedback again.
A “you asked, we fixed it” message after resolving a checkout error does three things: it confirms the customer was heard, demonstrates the system is working, and increases the likelihood of honest feedback in the next cycle.
Then measure whether the fix worked. Did the checkout completion rate rise? Did support ticket volume on that topic drop? That measurement is your ROI evidence, and it is how CFM earns its budget.
Here’s a set of tools to help you with customer feedback management:
Why Is Your Customer Feedback System Not Working? 7 Failure Modes to Diagnose
If your feedback is collecting but not changing anything, one of these seven breakdowns is almost certainly the cause.
1. No Objective Was Defined Before the Survey Launched
Teams send surveys without tying them to a specific business problem. The result is generic data that does not connect to any metric anyone tracks.
Fix: Define one KPI before launching any survey. Is this about churn, onboarding friction, conversion, or ticket volume? That decision shapes every question and every downstream action.
2. Surveys Are Going Out at the Wrong Time
Post-experience email surveys capture how customers feel after leaving, not why they left. Response rates are low, and the data are retrospective.
Fix: Move the collection to the moment of experience. Exit-intent nudges, post-onboarding micro-surveys, and in-app triggers at known drop-off points generate data you can act on while the customer is still reachable.
3. No One Is Coordinating Who Gets Surveyed When
In most companies, product, support, marketing, and customer success all send surveys independently. A customer who completes an onboarding flow, opens a support ticket, and visits the pricing page in the same week can receive three separate feedback requests with no coordination between them.
The result is over-surveying, which degrades response rates, increases opt-outs, and creates a fragmented data picture where no team has a complete view of what any individual customer actually experienced.
Fix: Build centralized sampling governance. This means:
Frequency Caps per Customer: No customer should receive more than one survey request within a 14-day window, regardless of which team is sending it. This rule is enforced at the platform level, not by asking teams to coordinate manually.
Customer Quarantine Rules: Customers in active escalation, within their first 7 days, or who have churned within the past 30 days are excluded from all non-essential survey triggers. Surveying a customer mid-escalation damages the relationship before you have had a chance to resolve the issue.
A Survey Calendar Reviewed at the Monthly VoC Triage:Before any team launches a new survey initiative, it is added to the shared calendar and reviewed for conflict with existing triggers. This is a 10-minute check that prevents the most common coordination failures.
4. Feedback Is Scattered Across Systems With No Single Owner
Support holds one set of complaints, product holds another, and sales has a third. No one has the full picture, and cross-team coordination never happens.
Fix: Centralize all feedback into one tagged repository. Every category has a named owner and a review cadence. Weekly triage with a VoC lead keeps routing honest.
5. Analysis Paralysis Is Killing Momentum
Teams receive data and debate it. Prioritization meetings run long, consensus never arrives, and by the time a decision is made, the window to act has closed.
Fix: Use the impact-effort matrix above. Anything high-impact, low-effort gets acted on within the current sprint. Everything else is placed in a structured backlog with an assigned owner and a due date.
6. Internal Resistance Is Burying the Insights
Feedback threatens existing roadmap priorities. Teams push back when insights challenge decisions that have already been made.
Fix: Start with a single survey on a single friction point, act visibly, and share the result with leadership in revenue terms. One proven win earns more buy-in than any process mandate.
7. The Loop Is Never Closed
Customers give feedback and hear nothing back. Response rates drop over time because customers learn the system does not actually do anything.
Fix: Build a follow-up message into every feedback workflow.
A changelog entry, an in-app notification, or a targeted email that names the specific change made is enough to restore trust and rebuild response rates.
8. ROI Is Never Proven
Feedback programs lose budget when no one can connect surveys to revenue. Leadership asks “what did this change?” and the answer is a CSAT score with no business context.
Fix: Establish baseline metrics before launch, measure lift at 30 and 90 days, and translate the improvement into revenue terms.
CustomerGauge research shows that a 10+ point increase in NPS correlates with a 3.2% increase in upsell revenue. That is the language that protects the budget.
How Does Real-Time Feedback Loop Automation Fix the “Data Sitting Idle” Problem?
The most consistent frustration among product managers and CX leads is not a lack of feedback. It is that feedback never reaches the person who can act on it in time to matter.
Real-time automation is the structural fix. When a response comes in, the system does not wait for a weekly review.
It routes that signal immediately to the right tool and the right person. Here is what a working automated loop looks like end-to-end:
- A user submits an NPS score of 4 through an in-app Nudge.
- The response is automatically tagged as a detractor based on the score.
- A Slack alert fires to the assigned customer success manager within minutes.
- The customer’s Salesforce or HubSpot record is updated with the score and verbatim response.
- A follow-up task is created for the CSM to contact that customer within 24 hours.
- If the verbatim mentions a product bug, a ticket is auto-created in Jira or Asana.
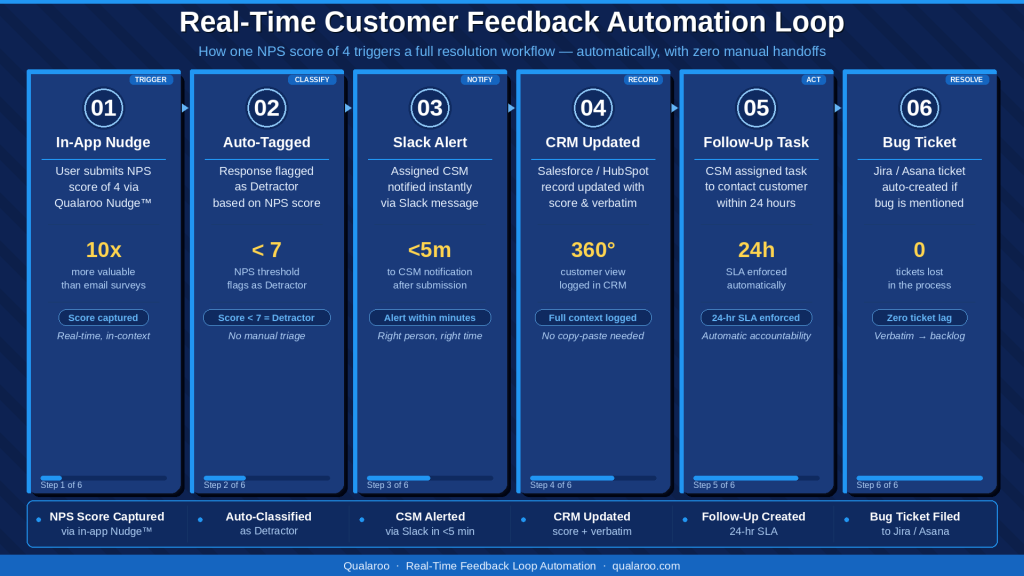
None of that requires a human to read a spreadsheet on Monday morning. By the time that review would have happened, the customer had already been contacted.
The same logic applies to feature requests.
When 10 users on the same plan tier submit the same request within 2 weeks, a well-configured system automatically surfaces it as a pattern rather than waiting for someone to notice it buried in a dashboard.
Beyond routing automation, AI-assisted analysis is changing what is possible at the analysis stage of the loop. Four capabilities worth building into your CFM system where your toolset supports them:
Semantic clustering groups open-text responses by meaning rather than keyword match. Responses saying “I can’t find where to change my plan” and “upgrading isn’t obvious” cluster together even without shared vocabulary. This matters because keyword-based tagging misses synonymous friction unless analysts read every response manually.
Automated root-cause synthesis surfaces probable causes for a detected sentiment shift without requiring manual investigation. When NPS drops 8 points in a two-week window, a system with this capability can surface the verbatim themes that appeared most frequently in that period, giving the team a starting hypothesis before they open a single spreadsheet.
Anomaly detection flags unusual patterns in real time: a sudden spike in a previously stable theme, a new complaint category appearing for the first time, or a sharp drop in response rate on a high-value trigger point. These signals matter most in the first 48 hours after a product change or pricing update.
Proactive alerts route a summary of the top emerging themes to the relevant team on a defined cadence, without requiring anyone to log into the dashboard to check. When the insight reaches the person who can act without that person having to look for it, the average time from signal to decision shortens significantly.
Qualaroo integrates seamlessly with Salesforce, HubSpot, Slack, Zendesk, and Zapier out of the box. The routing configuration takes hours to set up. The compounding benefit runs for months.
FREE. All Features. FOREVER!
Try our Forever FREE account with all premium features!
How Do You Build a Feedback ROI Attribution Model That Leadership Will Believe?
Feedback programs get cut when they cannot be connected to revenue. Here is a repeatable five-step model for building that case.
Step 1: Record the Baseline Before You Change Anything
Before launching any survey initiative, document the current state of the metric it is designed to affect.
For example, checkout abandonment rate, NPS score distribution, support ticket volume on a specific issue, or free-to-paid upgrade conversion rate.
Without a baseline, there is no before-and-after story to tell.
Step 2: Build the Feedback-to-Action Chain
Document four things for every initiative: the question asked, the top theme that emerged, the change made in response, and the date of the change.
This chain is your attribution record. Example chain:
- Question: “What stopped you from upgrading today?” (triggered on the plan selection page, exit intent)
- Top theme: Users did not understand the difference between plan tiers
- Action: Redesigned pricing page with a side-by-side comparison table
- Metric targeted: Free-to-paid upgrade conversion rate
Step 3: Measure the Lift at 30 and 90 Days
Thirty-day data can be noisy on small sample sizes. Ninety-day data gives you a cleaner signal. Measure the target metric at both points and document the delta.
Step 4: Translate the Lift Into Revenue Terms
A metric improvement only earns budget when it is expressed in dollars.
If the upgrade conversion improved by 2 percentage points across 5,000 monthly free users and the paid plan is $49 per month, that is 100 additional paying customers, or $4,900 in new monthly recurring revenue from one survey insight acted on.
If churn dropped by 1.5 percentage points on a base of 2,000 customers at $100 per month average, that is 30 retained customers, or $3,000 per month in retained revenue.
According to a popular HBR study, acquiring a new customer costs 5 to 25 times as much as retaining an existing one, making even small churn reductions highly leveraged investments.
Attribution Caveats Worth Stating to Leadership: The model above establishes a plausible causal chain, but it does not prove causation. A conversion rate improvement that follows a pricing page redesign may also reflect a seasonal traffic shift, a concurrent marketing campaign, or an unrelated product update that shipped in the same window.
Two practices that strengthen the attribution claim without overstating it:
First, document all other significant changes that occurred in the measurement window. If the pricing page redesign shipped alongside a new ad campaign, acknowledge both as contributing factors and attribute the lift proportionally rather than entirely to the feedback-driven change.
Second, use a control group where possible. If you can compare conversion rates from a segment that saw the updated page against one that saw the original during the same window, the comparison is cleaner than a simple before-and-after.
Present ROI attribution as a directional business case, not a precise accounting. Leadership understands that correlation is not causation.
What earns credibility is showing that you have documented the chain, controlled for obvious confounders, and used conservative estimates rather than best-case figures.
Step 5: Build a Rolling Dashboard Across All Active Initiatives
Track every active feedback initiative in one view: metric before, metric after, estimated revenue impact, and current status.
Review it monthly with the VoC lead. Present it quarterly to leadership with the attribution chain attached.
The KPIs that belong in this dashboard:
- Monthly churn rate, before and after feedback-driven changes
- NPS score trends by customer segment
- CSAT score by interaction type and channel
- Check-out or upgrade conversion rate
- Support ticket volume on identified friction points
- Feature adoption rate for features built from feedback data
Who Owns What in a Customer Feedback Management Process?
Every one of the seven failure modes above has the same root cause: no one clearly owns the step that broke down.
The table below is not an org chart; it is the ownership structure that maps directly to fixing each failure mode.
| Role | Owns | Review Cadence |
|---|---|---|
| Product Manager | Feature request themes, product NPS, roadmap prioritization | Weekly |
| Customer Success | Detractor follow-up, account health, renewal risk | Real-time alerts and weekly review |
| UX/Design | Usability issues, onboarding friction, navigation confusion | Bi-weekly |
| Marketing | Messaging clarity, pricing page signals, and landing page data | Monthly |
| Support Lead | CSAT scores, ticket reduction trends, repeat issue patterns | Weekly |
| VoC or CX Lead | Cross-functional synthesis, KPI dashboard, closed-loop reporting | Monthly |
| Leadership | ROI attribution, budget review, strategic customer themes | Quarterly |
One person should own a weekly 30-minute triage where feedback from all channels is reviewed and routed. The goal is that no response sits unassigned for more than a week.
Internal SLAs by response type: Not all feedback requires the same response speed. Define these in writing before you launch:
- Detractor NPS scores (0 to 6): customer success follow-up within 24 hours
- Critical bug reports or escalations: product or engineering acknowledgment within 48 hours
- Feature requests and UX friction themes: reviewed and triaged within the weekly cycle
- Positive feedback and promoter scores: routed to marketing for case study or referral outreach within 5 business days
Escalation Rules: Define what triggers an escalation to the VoC lead or senior leadership. A single complaint is noise. The same complaint appearing in more than 15% of responses from a high-value segment within a two-week window is a pattern that warrants escalation.
Build this threshold into your tagging system so it surfaces automatically rather than depending on someone noticing it.
RACI Structure for Recurring Themes: When a feedback theme recurs across multiple cycles without resolution, it needs a formal owner and a resolution deadline, not just a place in the backlog. The VoC lead is responsible for flagging recurring themes. The relevant team lead is accountable for the fix. The triage group is consulted. Leadership is informed on a quarterly basis.
Four people, a shared dashboard, and a standing agenda can run this. The discipline is in the written SLAs, not the meeting format.
How Do You Build a Closed-Loop System That Compounds Retention Over Time?
A closed loop is not just acting on feedback. It is a repeating cycle where each round of action produces higher-quality input in the next round, because customers who see their feedback change something are more likely to respond honestly in future surveys.
The retention effect is real but indirect: it comes from the trust built by visible follow-through, not from the loop mechanism itself. Do not overstate this to leadership.
The compounding benefit is in data quality and response rates, which in turn improve the quality of decisions. The retention improvement comes from acting on better decisions, not from running the loop.
Here is how the compounding works in practice:
Round 1: Collect, Act, and Announce
Launch one well-targeted Nudge. Act on the top insight. Email the affected customer segment with a specific message about what changed and why.
Response rates from this segment in your next survey will be higher because customers now believe the system works.
Round 2: Follow-Up to Verify
After announcing the change, ask the same customers whether it solved their problem.
This closes the loop properly, generates your before-and-after data, and produces the next round of insight from customers who are now more engaged.
Round 3: Expand Coverage
Once the loop is running reliably on one touchpoint, extend it to the next. Onboarding feedback surfaces retention risks. Retention feedback surfaces expansion and upsell signals.
For structured NPS and CSAT tracking across the full customer journey (beyond in-context Nudges), ProProfs Survey Maker integrates directly with Qualaroo workflows.
This provides longitudinal trend data and dashboard views that leadership needs to see the program’s cumulative impact.
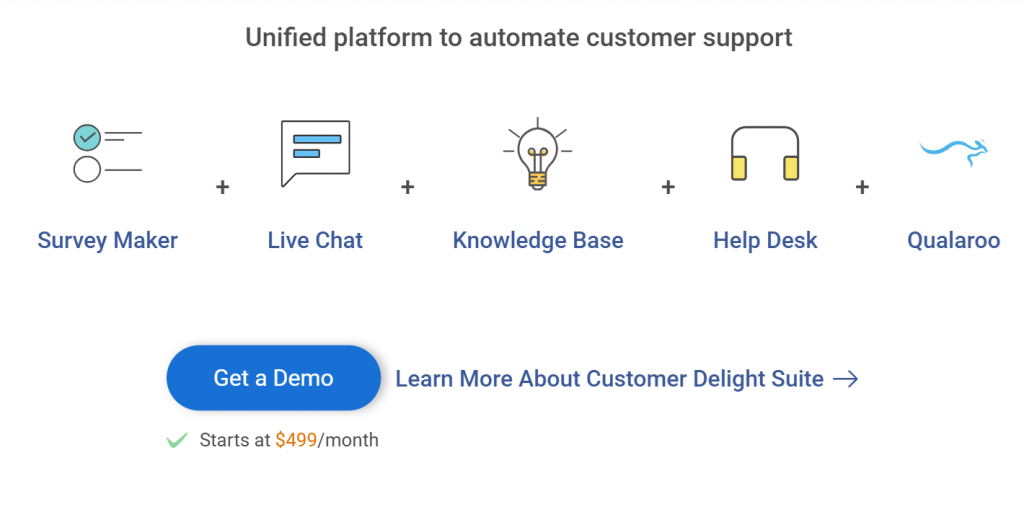
There is also a Customer Delight Suite you can use for effective customer feedback management:
What Metrics Should You Track to Know If Your Feedback System Is Working?
Tracking the wrong metrics is how feedback programs stall out. Here is the full set of customer metrics, organized by what each tier tells you.
Feedback Health Metrics — tells you whether the collection side is functioning.
- Survey response rate by channel and trigger point (target: 15 to 30% for behavior-triggered Nudges)
- Feedback volume by category per week
- Time from survey deployment to the first actionable insight surfaced
- Percentage of responses tagged and routed within 48 hours
Customer Experience Metrics — tells you whether the action side is working.
- NPS score and distribution by customer segment
- CSAT score per support interaction type
- Customer Effort Score (CES) for high-friction workflows
- Churn rate by cohort, before and after feedback-driven changes
Business Impact Metrics — these justify the program to leadership.
- Conversion rate lift on pages where survey insights drove changes
- Support ticket volume reduction on issues addressed by product fixes
- Monthly recurring revenue retained through churn reduction
- Upsell or upgrade conversion rate improvement tied to feedback-driven features
Review feedback health metrics weekly.
Review customer experience and business impact metrics monthly, and present them quarterly to leadership with the ROI attribution chain attached.
Here’s a complete CFM toolkit for you for ROI attribution, metrics measurement, and more:
FREE. All Features. FOREVER!
Try our Forever FREE account with all premium features!
Data Governance and Privacy in Customer Feedback Management
A CFM system that combines surveys, support tickets, reviews, behavioral data, and CRM records is also a system that collects, stores, and processes personal data at scale. Data governance is not optional.
1. Data Ownership: Define which team owns the feedback data collected from each channel and who is authorized to access, export, or delete it. In most organizations, the VoC or CX lead owns the survey data, while the support lead owns ticket data. Shared dashboards should operate on role-based access, not open access.
2. Retention Policies: Decide how long raw feedback data is retained before it is anonymized or deleted. Many organizations retain identifiable feedback for 12 to 24 months and then anonymize it for trend analysis. Retention periods should be documented and enforced at the tool level, not managed manually.
3. Consent and Transparency: Customers should know that feedback is being collected, how it will be used, and who will have access to it. For behavioral data collection such as heatmaps and session recordings, explicit notice is required in most jurisdictions. For survey-based feedback, a brief disclosure in the survey interface is standard practice.
4. GDPR and CCPA Compliance: If you have customers in the EU, your feedback collection and data processing practices must comply with GDPR. If you have customers in California, CCPA applies.
Key obligations include providing a clear privacy notice, honoring data subject access and deletion requests, and ensuring that any third-party tools processing customer feedback data operate under a valid data processing agreement.
If you are unsure whether your current setup meets these requirements, consult your legal or compliance team before expanding your feedback collection infrastructure.
5. System Integration Governance: When feedback data flows between tools (from Qualaroo into Salesforce, from Slack into Jira), each integration point is a potential data governance gap. Document what data moves between which systems, confirm that each receiving system is covered by your privacy policy, and audit the integration list quarterly.
Your Customer Feedback Management System Is Only as Good as What Happens After the Response Comes In
Most teams already know what is broken. They have responses sitting in a queue, a spreadsheet no one owns, and insights that never made it to the roadmap.
The fix is not more surveys.
It is a cleaner system: the right question at the right moment, routed automatically, acted on with evidence, and closed with a message that tells customers their input actually changed something.
That is the loop. Run it once on one friction point, and you will have the data to justify running it everywhere.
Qualaroo’s Nudge™ technology is built for the in-context collection piece: behavior-triggered, non-intrusive, and live without a developer inside an hour.
Frequently Asked Questions
How do you manage customer feedback across multiple teams without it falling through the cracks?
Build routing rules at the tool level, not the process level. A detractor NPS score should automatically trigger a Slack alert to customer success. A feature request should auto-create a backlog card. When routing is automatic, nothing depends on someone remembering to forward an email.
What is the difference between user feedback management and product feedback management?
User feedback management covers the full customer journey across all touchpoints. Product feedback management focuses specifically on feature requests, usability issues, and product NPS. Both use the same system but route to different owners: product feedback goes to the PM, broader user feedback routes to CX and customer success.
How do you prove ROI from a customer feedback management program?
Record the target metric before launch, act on the top insight, and measure again at 30 and 90 days. Convert the improvement into revenue terms. A 2-point lift in checkout conversion across 5,000 free users on a $49 plan equals $4,900 in new monthly recurring revenue from one insight.
How do you avoid survey fatigue while still collecting enough feedback?
To reduce survey fatigue, use behavior-triggered surveys instead of time-based email cadences. A single question triggered by exit intent or a completed workflow is contextually relevant and takes under 10 seconds. Keep surveys to one or two questions, exclude users who have already responded, and set expiration windows.
What is the right cadence for running NPS surveys?
Trigger transactional NPS immediately after key interactions such as onboarding, support resolution, or renewal. Run the relationship NPS quarterly. Using both gives you a real-time pulse on specific touchpoints and a long-term loyalty trend line that leadership can track alongside revenue metrics.
How do you close the feedback loop at scale?
Use automated follow-ups. Set triggers in your CRM to send a targeted message whenever feedback drives a change. The message should name the specific problem and confirm what was fixed. A specific, attributed update rebuilds trust far more effectively than a generic acknowledgment.
Should we use reactive or proactive feedback collection, and what is the difference?
Reactive collection waits for customers to report problems. Proactive collection places questions at friction points before problems escalate, using triggers like exit intent or post-onboarding. Most teams need both. If you only run reactive surveys, start one proactive Nudge at your highest-friction touchpoint and compare the signal quality.
How do you get cross-team buy-in for a customer feedback management process?
Start with one initiative, connect it to one revenue metric, and share the result publicly. Teams that see feedback produce a measurable outcome, whether a churn reduction, a conversion lift, or a ticket volume drop, become advocates because it makes their own metrics move.
FREE. All Features. FOREVER!
Try our Forever FREE account with all premium features!
 We'd love your feedback!
What did you like & how can we make it even better?
 Thanks for your feedback!
 Ask Your Question
Have a question? Get expert help to make your decision easier.