What would you say if you were to name one crucial ingredient that makes or breaks the recipe for a successful business?
Hopefully, your answer is the same as ours – A healthy flow of new customers.
But, what if the customers slowly start to drop out, or in business terms, their churn rate goes up?
Well, that’s a situation you should be afraid of and do everything in your power to avoid.
Interestingly Netflix had a monthly average churn rate of 2.4% at the beginning of 2021 down from a range of 3.8-4.5% in 2010. And by the end of 2021, the streaming platform achieved an industry-low churn rate of 2.2%.
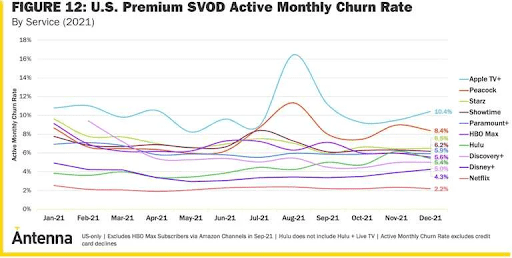
Besides high-quality content, algorithm recommendations, and email reminders, recognizing that there is churn in the sales funnel helped Netflix achieve these positive results.
So, if you are ever stuck in the same tide, how would you know what to do and turn the tide in your favor, i.e., to reduce the churn rate?
To help you with this, our article answers all the crucial answers you need to know, from how churn affects your business to how you can calculate it.
What is Customer Churn?
The percentage of customers who stop shopping from you or stop using your services is called customer churn.
There are numerous reasons why a customer may decide to cut all ties with your business. So, by calculating the customer churn rate on time, you can stop other customers from following in the footsteps of those who churned away.
What is the Churn Rate Formula?
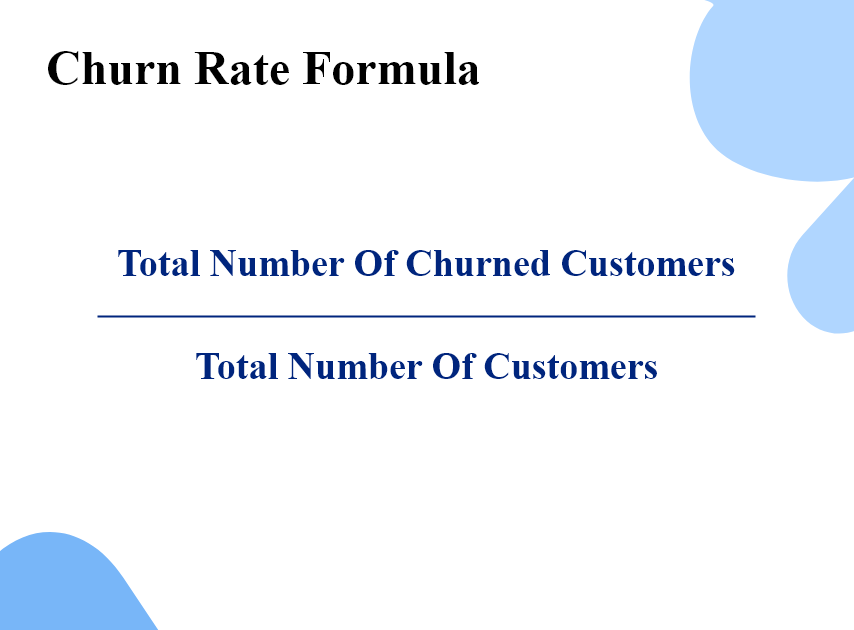
Every company wants its customer churn rate to be 0%, which is sort of impractical. You can still keep it somewhat closer to 0%, and to do that, you need to know where you currently stand. A popular formula used for calculating churn is:
There are many ways to calculate it:
- By calculating the percentage of lost customers.
- By calculating the value of the lost recurring business.
Types of Customer Churn
To reduce your churn rate, you first need to understand the nature of churn to apply customized and effective strategies.
Involuntary Churn
With the self-explanatory name, involuntary churn refers to customers leaving without their own choice. Many reasons are responsible for such an occurrence.
For example, a company discontinues a product/service that customers particularly liked or were there solely for it.
Another example is the payment failure on the part of customers who are not aware of it. For example, an expired card, a maxed-out credit card, or network failure are just a few reasons that can lead to payment failure, thus leading to canceled subscriptions or payments.
You can avoid all this by deploying smart payment recovery strategies and ensuring the checkout page is optimized and safe for customers to use.
Voluntary Churn
Voluntary churn is when a customer decides they no longer want to avail of your services or use your product. They voluntarily cancel their subscription with you and unsubscribe to your newsletters and other email campaigns.
Because churn is a decisive action, organizations prioritize this type of churn and focus on reviving their retention rate with customers who may churn voluntarily.
Customers can churn for as many reasons as there are drops in a sea (figuratively, of course), but here are the common ones:
- The company falls short of delivering a fantastic customer experience.
- Unmet expectations from the company and its products/services.
- Failure to resolve pressing customer issues.
- An unsatisfactory or unpleasant encounter with your product/service since all it takes is a bad experience for them to churn.
- Unsatisfactory experience with service representatives.
- Customers are going out of business, so they don’t require your products/services.
So, how can you reduce voluntary churn?
In the simplest way and in few words possible, understand your customers inside out.
Make it a priority to empathize with them and know their pain, satisfaction, expectations, needs, and wants.
Once you know what they need, everything else falls into place. You can direct y0ur strategies towards delivering what they want and exceeding their expectations.
Focus on providing value to customers’ experience and interactions with your business, and you’ll start to see positive results.
One of the most effective ways to get to know your customers is by asking them. Feedback software such as Qualaroo is one platform you can leverage.
Acting as a customer churn software, it takes care of everything from helping you create pop-up surveys using pre-built templates to analyzing the verbatim responses via IBM-Watson Sentiment Analysis.
How Does Churn Rate Affect Businesses?
You need to have a complete picture, i.e., the extent to which the rate can harm your business or ways in which it cripples your company, to take the proper measures in the right direction.
Some side-effects of churn are:
High Customer Churn Points Towards Grave Issues
Another concern that a high churn rate poses for companies in the presence of grave underlying issues causing customers to churn away. If customers are happy and satisfied, they won’t leave you. It shows loopholes in your strategies.
Conducting gap analysis helps analyze the shortcomings that are stopping you from achieving your goals. It explores if customer expectations are being met, if they are satisfied with your products/services and if your onboarding process is effective or not.
Besides, you can also conduct surveys such as Net Promoter Score to see how many customers are loyal to your company and which customers are at the risk of churning.
Prevention is always better since once the customers churn, there isn’t a cure anymore.
Makes Your Competitors Win At The Game
The favorite meal of your competition is to eat your company at lunch. They leverage your weaknesses to show their strengths.
No matter how good your marketing campaigns are, if the bad word gets out and into the ears of your competitors, they’d make sure to make it the talk of the town.
Along with tarnishing your company’s reputation, what it does is make your customers start comparing your products/services with others and are practically made to focus on your faults.
For example, a negative discussion about your products/services, negative customer reviews, and anything that highlights your drawbacks would ultimately lead to customer churn.
And even worse, your competitors would welcome the churned customers with exciting deals, discounts, and extravagant marketing.
One such example is the feud between the well-known burger joints Burger King and McDonald’s. Their rivalry dates back to the 1980s and continues to this day.
Below is an example of one of the many roasts between the two food chain giants. In the advertisement, you’ll see how Burger King emphasizes the fallacy of McDonald’s in naming their burger “Big Mac” and how it can easily hide behind Burger King’s MASSIVE Whopper.
View this post on Instagram
Churn Hurts Your Valuation
From a stakeholder/investor’s perspective, a high churn rate isn’t promising at all. It reflects poorly on the functioning of a company, and they may develop doubts about the future of your business.
The churn rate plays an even more significant role when seeking investment through venture capital. The stakeholders determine by looking at the churn rate if your business is stable and can stand the test of time and cut-throat competition to emerge victorious in the end.
Retention rate is especially pivotal in the Software-as-a-Service landscape. So, if you are from this industry, a high churn rate can be damning for your business.
SaaS investors generally evaluate customer lifetime value (LTV) as a crucial metric to judge how well your business is going in terms of profit and revenue. A high churn rate means a low LTV, which doesn’t paint your business in a good light.
FREE. All Features. FOREVER!
Try our Forever FREE account with all premium features!
How Does User Churn Rate Affect Other SaaS Metrics?
Churn rate and customer lifetime value share an intense cause-and-effect relation, as briefly mentioned above. Change in one is immediately reflected in the other. Besides LTV, there are three more crucial SaaS metrics that customer churn rate affect
MRR (Monthly Recurring Revenue)
MRR is dependent on the stability of the customers. If more customers slip away, your MRR will also start to decline. For any SaaS business, MRR is a backbone in terms of revenue source. Not only this, but it also indicates an organization’s viability.
Net Negative MRR Churn
Net Negative MMR Churn helps SaaS enterprises grow and increase their overall revenue. With net negative churn, a company earns additional revenue from the existing customers, more than the revenue lost due to customer churn. So, if the churn rate is high, the net negative MRR churn will decline.
Customer Acquisition Cost
Customer acquisition cost (CAC) is the cost of resources you spend to acquire new customers. If the customers churn before you get your money’s worth, you face losses. So, ultimately a low churn rate would mean that the money you spend on acquiring customers is not wasted.
4 Different Ways to Calculate Churn Rate
Besides the standard formula for calculating customer churn rate discussed above, the data specialist at Shopify, Steve Noble, came up with four more ways to calculate the churn rate.
So, now the question of “How to calculate churn rate” has multiple answers. Let’s discuss them one by one and explore their pros and cons along the way.
Before discussing how to calculate, you should know a few terminologies to understand what’s going on.
| Customers | List of customers on any given day, which is represented by “i.” Customers of specific days are represented by ‘n.’ For instance, Customers_1 would represent customers on day 1 when you started calculating churn. |
| Churned Customers | Customers that churn during the observed period. |
| n | Number of days chosen to observe over a month while calculating. So, “n” can refer to 28, 29, 30, or 31 days. |
Way 1: The Simple Way
One of the four ways invented by Steve is, as he called it, the simple way. The name reflects the nature of this formula that it is simple to perform.
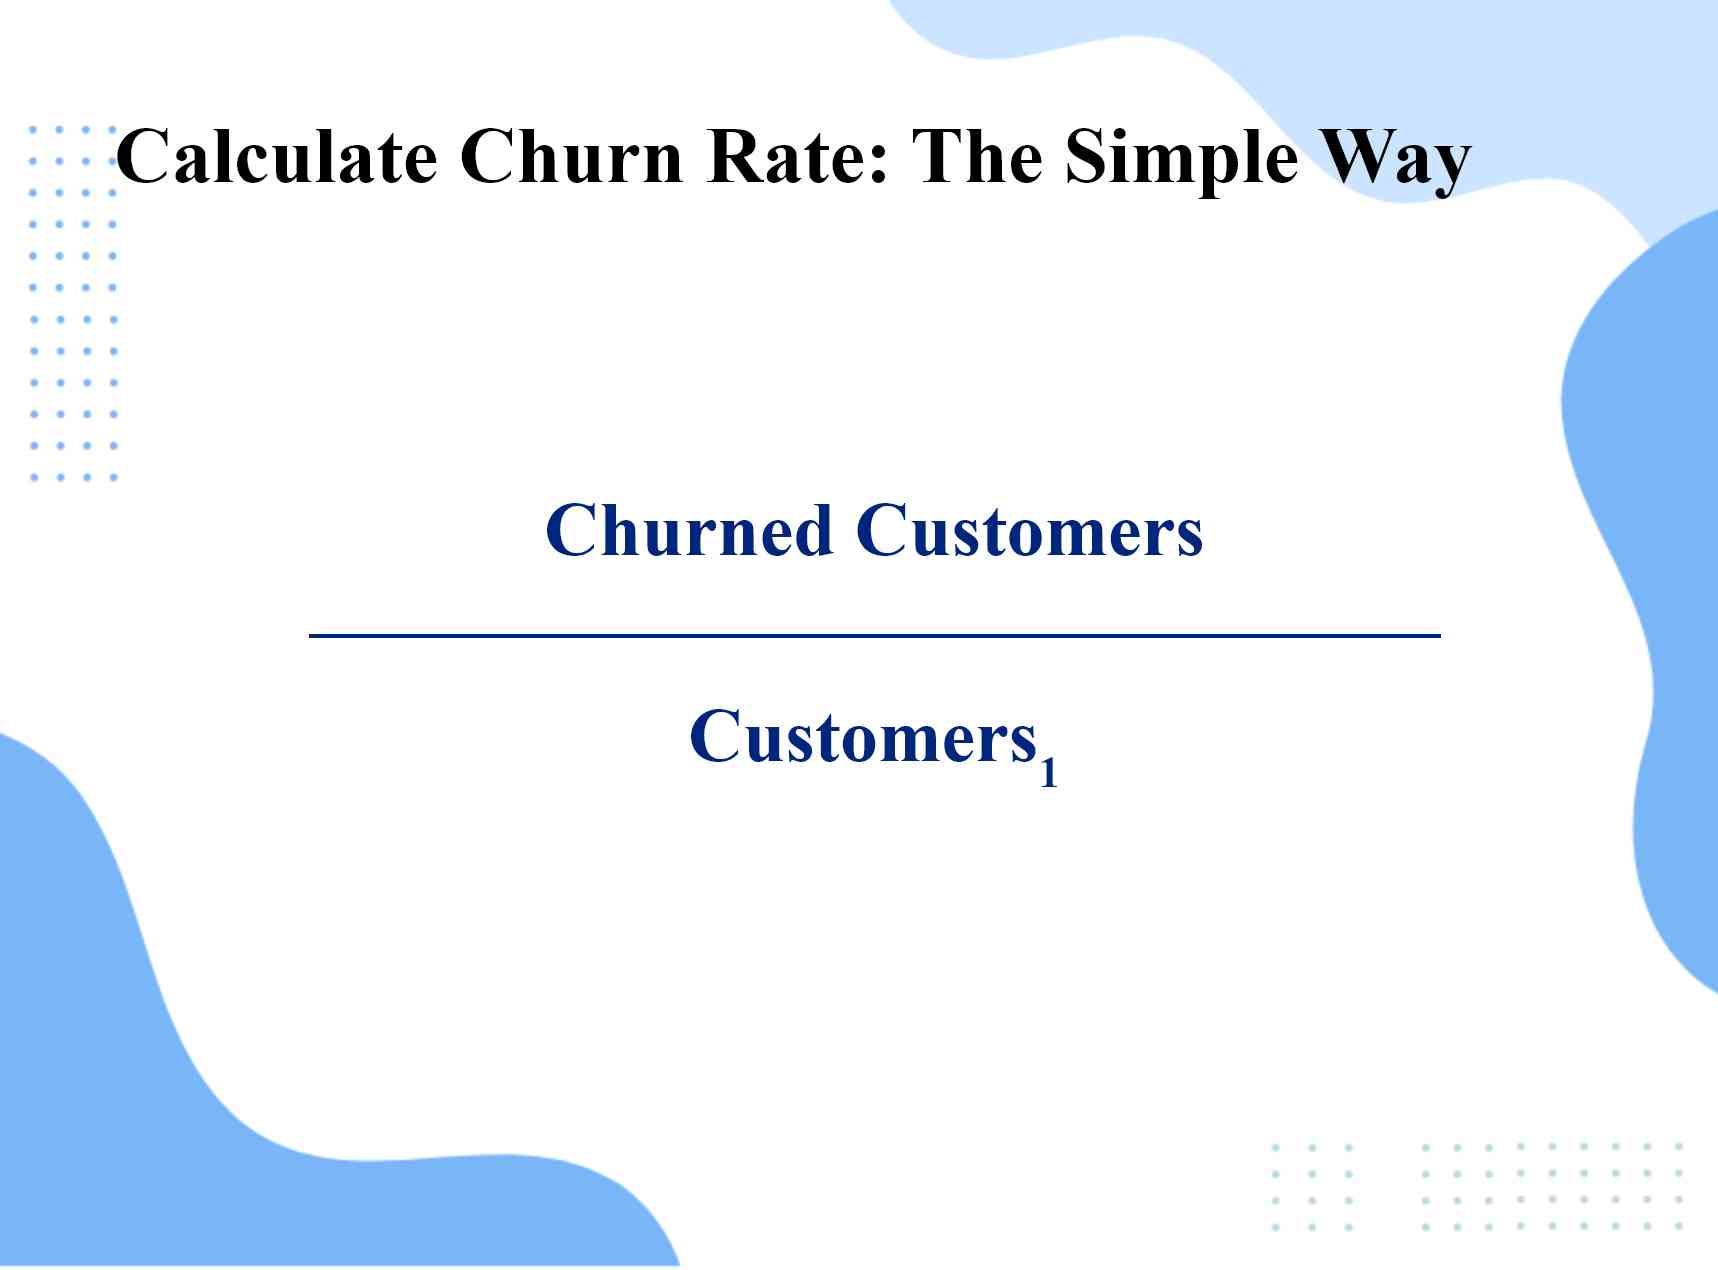
Here, you divide the number of churned customers by the total number of customers you had on the first day.
Pros
- Very simple to calculate
- Only needs two variables for calculation
- Makes comparison between two or more months easy
Cons
- Not suitable for small or new businesses. As companies get bigger, so does the number of customers. They develop a stable customer base, so the churn is always lower than your total number of customers.
In the case of small or new businesses, the customer base is not stable as the new customers join each month, making this method unsuitable.
To make this clearer, let’s have a look at an example.
| Parameters | January | February |
|---|---|---|
| Customers in the beginning of the month | 10000 | 14375 |
| Existing churn | 500 | 625 |
| New Acquired customers | 5000 | 5000 |
| New churn | 125 | 125 |
| Total customers | 14375 | 19375 |
| Total churn | 625 | 750 |
| Churn rate | 0.043 | 0.038 |
| Calculation | Total churned customers = 625 Customers1 = 14,375 So, according to the formula: 625 = 0.043 |
Total churned customers = 750 Customers1 = 19,375 So, according to the formula: 750 = 0.038 |
The shortcomings of this method are evident from the above example. Even though the amount of churned customers was the same for both months (125), there is a big difference in the percentage.
February with more customers shows a low churn rate, which gives a false impression of improvement from the last month.
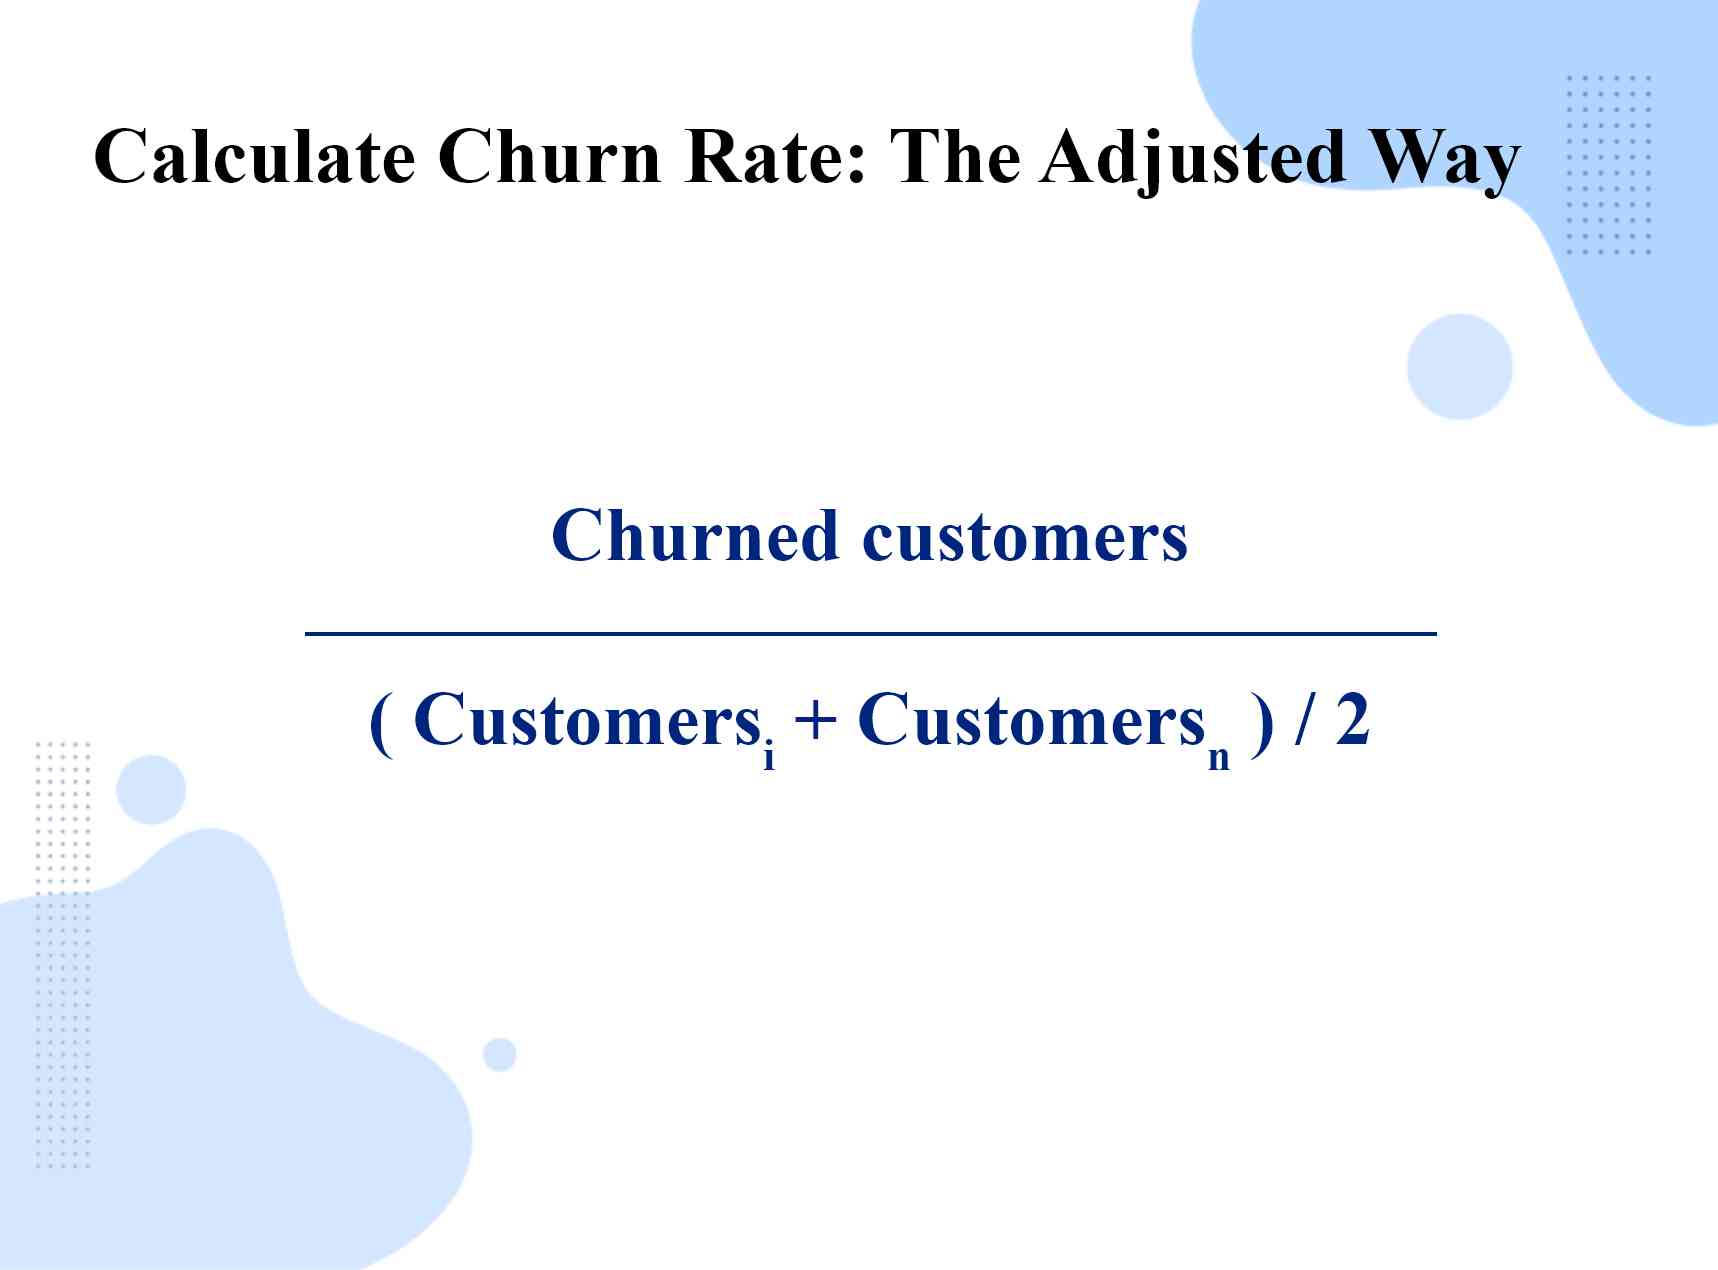
Way 2: The Adjusted Way
The simple method only considers value on the first of the month, but this method allows for taking values from any point of the month.
Pros
- It accommodates well with the growth, as opposed to the simple way
- The time window for customers can be the same as for churn
Cons
- Doesn’t scale with different time windows
- It would show different calculations for daily, weekly, and monthly churn
| Parameters | January | February | March |
|---|---|---|---|
| Customers in the beginning of the month | 20,000 | 28,500 | 36,500 |
| Existing churn | 1000 | 1500 | 2000 |
| New Acquired customers | 10,000 | 10,000 | 10,000 |
| New churn | 500 | 500 | 500 |
| Total customers | 28,500 | 36,500 | |
| Adjusted churn rate | 6% | 6% | 6% |
| Quarterly churn rate | 6.1% | 6.1% | 6.2% |
| Calculation | For Adjusted churn rate:
Total churned customers = 1500 Customers1 = 20,000 Customersn = New acquired Customers – Total churn = 10,000 – 1500 = 4,250 So, according to the formula: 1500 |
For Adjusted churn rate:
Total churned customers = 1600 Customers1 = 28,500 Customersn = New acquired Customers – Total churn = 10,000 – 20000 = 4,000 So, according to the formula: 2000 |
For Adjusted churn rate:
Total churned customers = 2500 Customers1 = 36,500 Customersn= New acquired Customers – Total churn = 10,000 – 25000 = 3,750 So, according to the formula: 2500 |
Up until now, all the numbers tally with each other, i.e., our monthly churn rate matches quarterly. It is because the churn rate is the same for all months (5%), and customer gain is 2.5%.
But if you don’t have the exact numbers across each month, monthly churn rates will differ from quarterly churn.
Way 3: The Predictive Way
As the name suggests, this method focuses on predicting the churn rate in advance to take proactive measures. It determines the weighted average churn rate. This way, the rate*customers will predict the potential churn on any day.
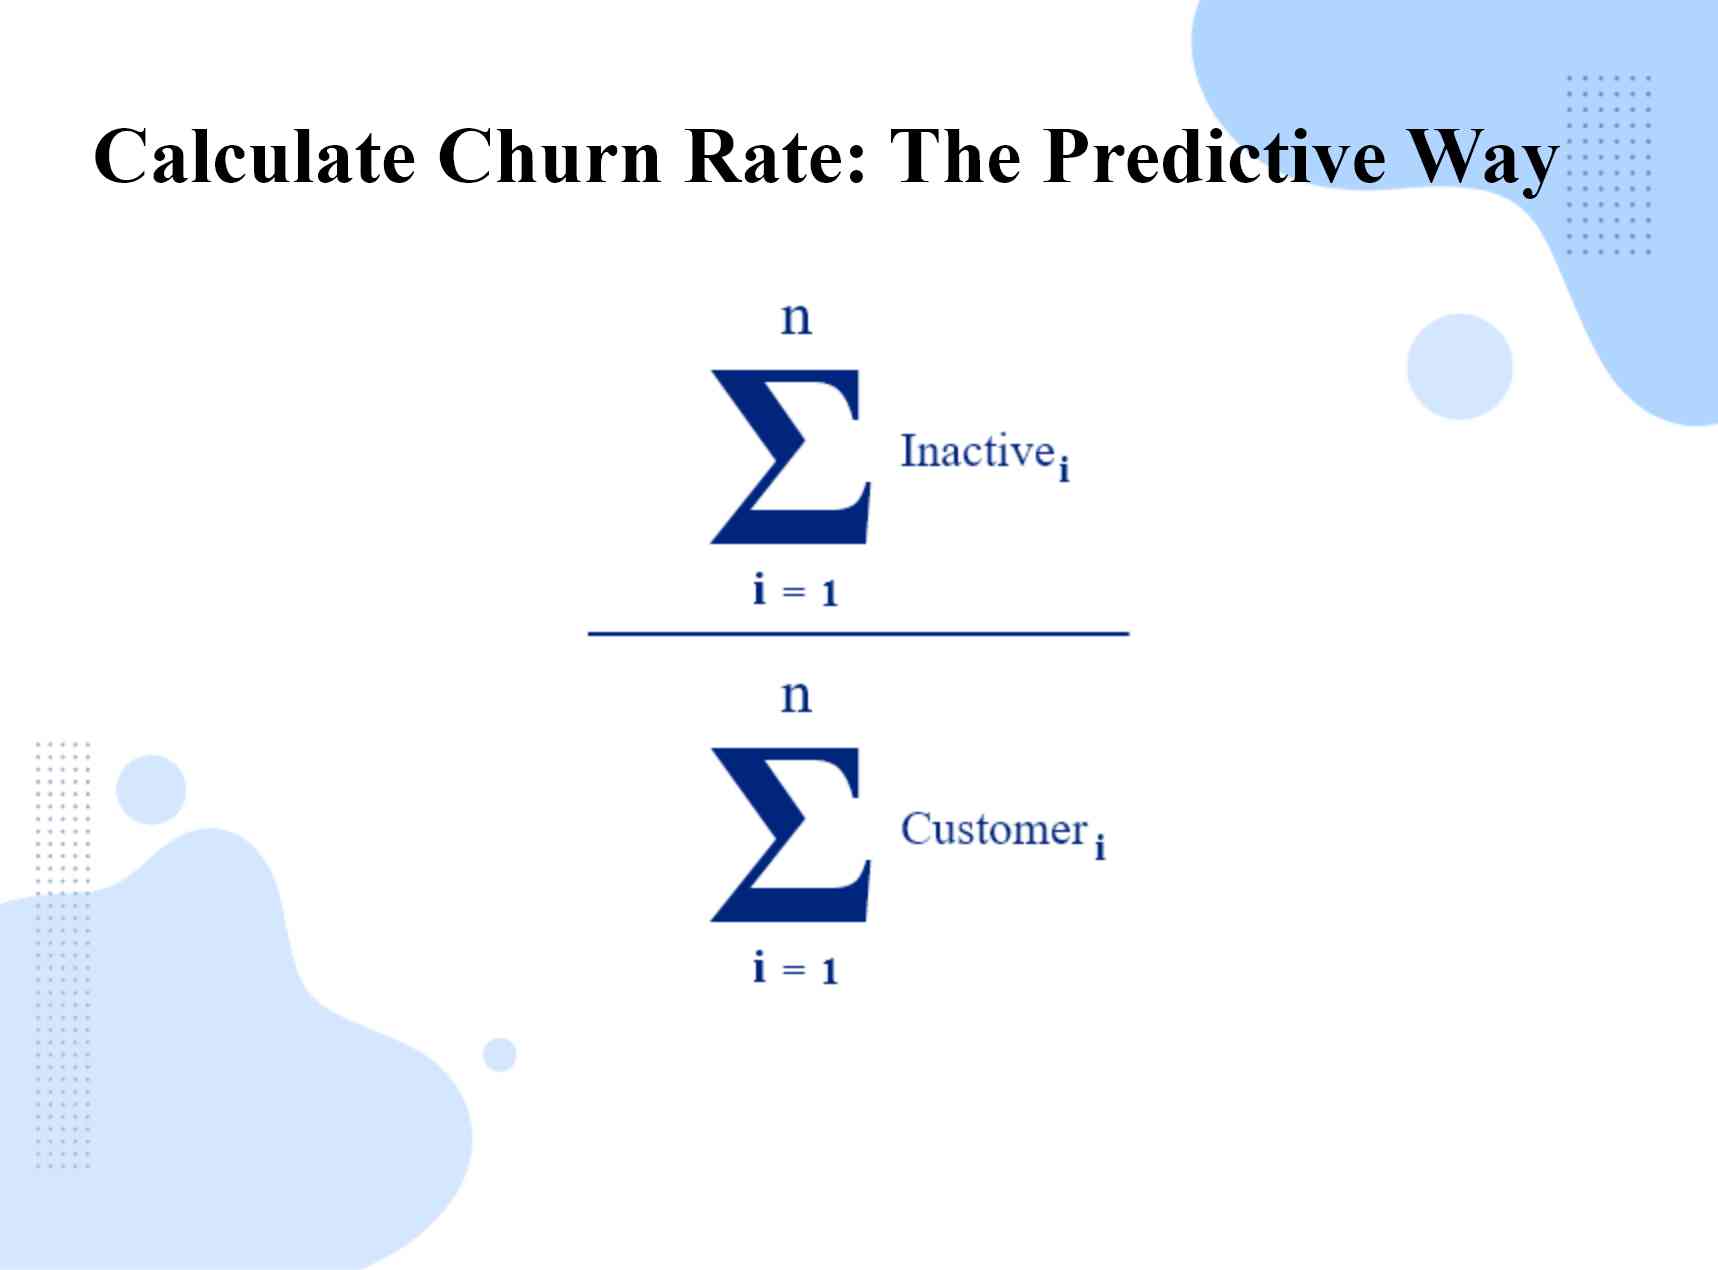
Here, the InactiveCustomers (Inactivei) shows the number of active customers on the day “i” and inactive on i+n, for instance, one month later.
For example, say you have 5000 customers on January 1. On February 1, you will predict how many of those customers churned on that day. You sum that up and divide it by the sum of total customers in January.
Pros
- Predicts churn
- It helps plan with finances due to its prediction quality
Cons
- It needs at least two months of data to predict churn for one consecutive month
- You will only know about the customers churned in January in February
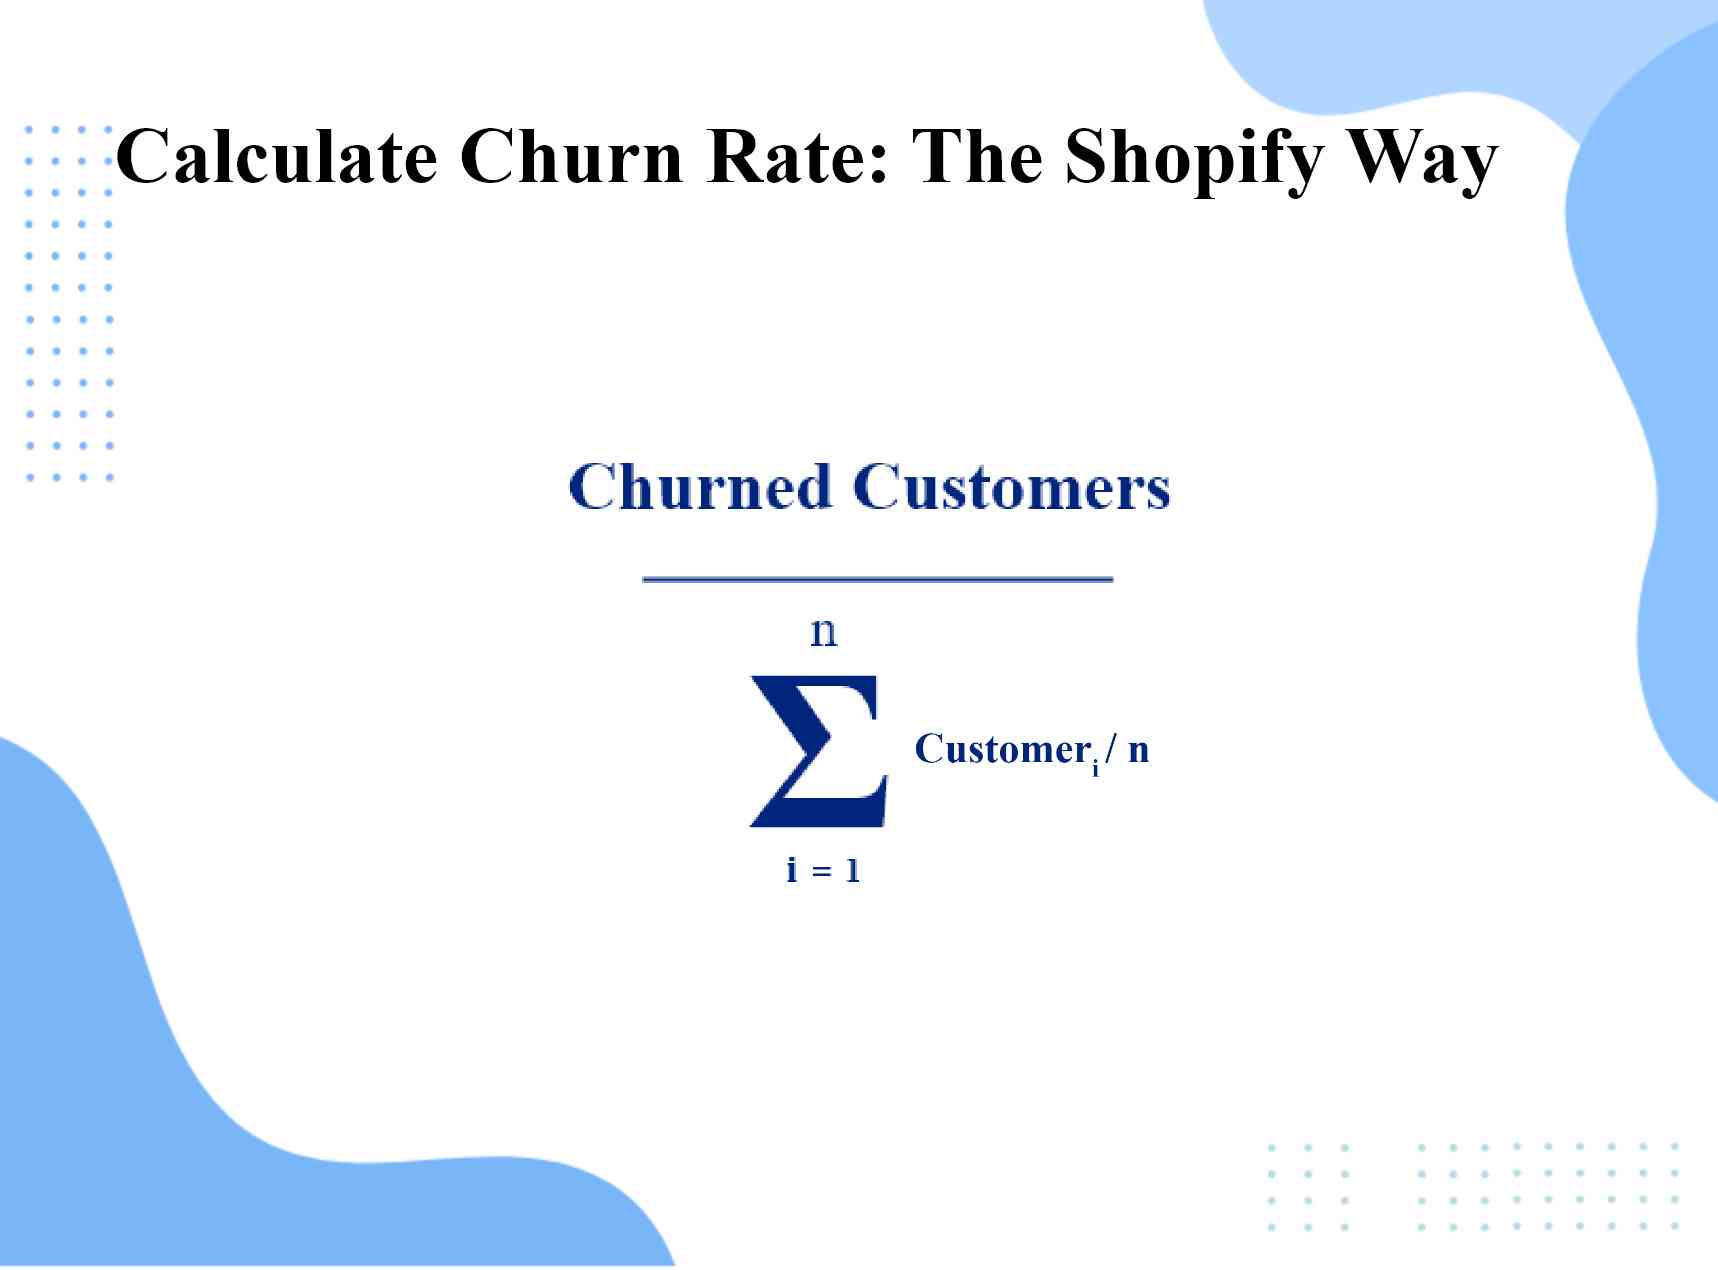
Way 4: The Shopify Way (Final Method)
Unlike the adjusted way, where you only take the average of the first and last days of the month, this method is different. In this final method, you take an average of every day of a month and zero in on the most accurate churn rate.
Pros
- Can be used during the growth of a business in terms of customers
- Scales perfectly for different time windows
- Gets you an up-to-date churn rate
Cons
- May mislead companies sometimes as it gives them the security since they check the churn rate daily/weekly/monthly, etc.
- It doesn’t capture the differences in cohorts, size, plans, increased pace of new customer churn, etc.
Various Steps to Take Post-Churn Calculation
If you calculated your churn and it’s worse than you anticipated, you need to do some profound damage control to prevent it from happening again.
Below are some necessary preventive steps to reduce your churn rate.
1. Keep an Eye on Churn
The best way to stop the churn trainwreck is by analyzing the customer behavior and the possible reasons that make customers leave.
Once you have those insights, you can take corrective actions to work on customer pain points and give them a customer experience they wouldn’t want to leave.
Always keep your eye on retention and churn rates so that you witness any new trend in its beginning and nip the problem in the bud.
Tools like eye tracking, mouse tracking, heatmaps, or even helpdesk systems are great ways to gather customer behavior insights besides the hard cold statistics.
With such customer churn software at your disposal, you can analyze individual experiences and get to the root problem to resolve issues.
For instance, you will know that a customer churned due to a bad experience with a customer support representative. This way, you can ensure it doesn’t happen again.
2. Train Your Sales and Customer Rep Teams
Training your sales representatives will ensure they can pitch your product/service to customers in the best way possible.
Besides this, you should also train your customer service representatives to attend to unsatisfied customers, resolve their problems and turn them into loyal customers.
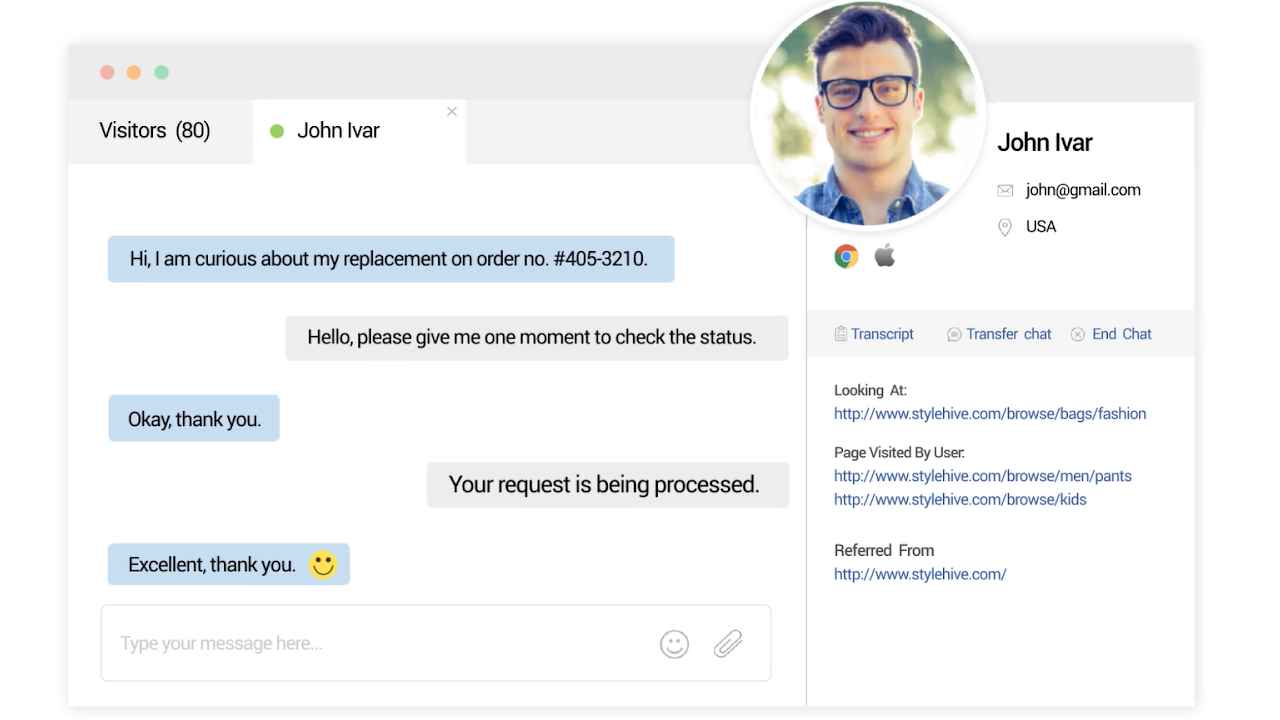
You can also add live chat to your mobility solutions and website so that you can offer customer support 24×7.
3. Collect Feedback at Key Points
Customer feedback can only save you when you are doing it right. Let’s understand how to use feedback efficiently to reduce churn.
When to Ask:
You can ask for feedback throughout the customer journey and on crucial touchpoints. It will give you an idea of the ground reality and where customers are getting stuck and need help within the customer journey.
For example, you can ask customers on the pricing page if the pricing is clear, ask customers on the product page if the information is useful, etc. You can also ask customers if they need your help when they are about to leave your website.
What to Ask:
If you want to gather valuable feedback, ask the right questions at the right time. Here are a few examples:
- “Does this page meet your expectations?”
- “Does this page contain the information you were looking for?”
- “Is there anything preventing you from signing up at this point?”
- “Is our pricing clear?”
- “What could we do to make this site more useful?”
- “Is there anything preventing you from completing your purchase?”
How to Ask:
You can stop the leaving customers by implementing exit-intent surveys before they leave your website. It’s also beneficial to create surveys specific to customer segments to collect in-context and accurate feedback.
Here are some effective survey types you can use to ask for customer feedback:
- NPS surveys to differentiate your promoters from detractors.
- CES surveys to understand how easy or difficult it is for customers to achieve a goal with your product.
- CSAT surveys to measure customer satisfaction after customers try your services or products.
Who To Ask:
If you effectively track metrics such as NPS and CSAT, you’ll be able to identify unhappy customers. These are the ones you need to focus on.
Target customers who gave you low ratings on surveys since they are the detractors on the verge of churning.
Where to Ask:
Apart from deploying surveys on your website and mobile app, you can also leverage social media and customer forums to watch out for customer feedback. It will ensure you don’t lose more customers.
A robust survey software like Qualaroo lets you do this and much more. It not only helps you with advanced targeting in terms of feedback but also helps you analyze the feedback
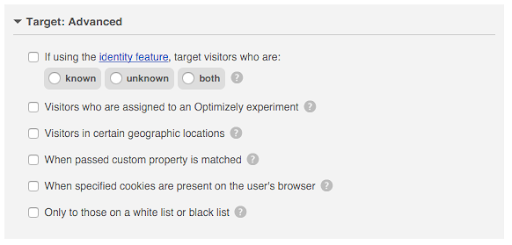
Discover more about how to target your survey here.
4. Free Trial Customers Are a Source of Rich Feedback
The customer churning reflects when you lose the revenue and when they are churning. It’s a little different with free trial customers.
Free trial customers are considered churned customers when they do not make a purchase.
You can ask them feedback like why didn’t they buy a subscription plan, what they think you can improve, and what they would have to do to encourage them to come back. For this, you can send a survey link through email.
5. Empower Customers to Resolve Small Queries Instantly
One of the effective ways to reduce customer churn is by making your customers independent in resolving simple and repetitive queries.
Tools such as a knowledge base allow your customers to understand your products/services better without depending on your customer support personnel.
The tool enhances customer experience as they derive more value out of your business offerings.
6. Develop a Robust Process to Monitor Customer Relationships
You should always aim toward prevention rather than finding a cure later. If you closely monitor customer relationship management, you’ll be able to find customers at the risk of churn and stop them from leaving.
You can use CRM tools like BIGContacts that help you create a process to keep track of all the customers and their experiences.
That’s enough theory; let’s look at some real-life churn rate examples of companies.
Churn Rate Examples of Companies That Are Doing It Right
Companies in the B2C space often publish their performance reports, including churn and retention rates. These churn rate examples of real-life companies would give you an idea of what to expect for your own business.
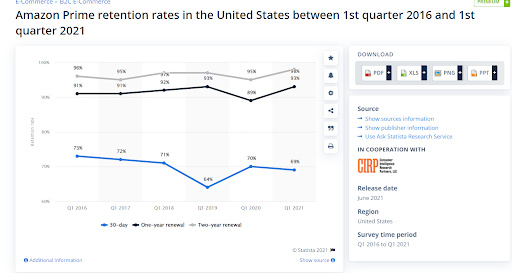
Amazon Prime
Amazon Prime is among a few OOT platforms with a lower churn rate than the industry standard. In 2018 itself, the churn rate for Amazon Prime was just 2.9% which is significantly lower than its competitors.
To reinstate its hold as a solid company, this report by Statista shows its increasing retention rate from 2016 to 2021.
The highest retention rate for Amazon Prime was seen in the first quarter of 2021 at a staggering 98%.
Now, who can beat this?
Pelton
Pelton offers exercise equipment and fitness subscription to its customers. It has the lowest churn rate of 0.76% compared to the average net monthly connected fitness churn rate.
Due to this, its retention rate game is going so strong that it gained 1.67 million subscribers in the first quarter of 2021, which is 134% more than the previous year.
What is a Good Churn Rate?
We mentioned earlier that 0% churn is a utopian dream, and it doesn’t exist.
Still, it’s not impossible to come close to this goal as you can achieve a good churn between 2-8%.
This rate is specific to B2B and B2C organizations offering self-serve solutions. For B2B companies with high average contract values, such as more than $1000 every month, an acceptable churn rate is 2%.
How Often Can You Calculate Churn Rate?
With the predictive way, you can efficiently conduct daily, monthly, or weekly analysis of your churn rate, but it’s not mandatory.
You won’t drive any conclusive insights from this kind of data since it won’t reflect any trends or behavior changes in the customers.
So, it’s better to conduct quarterly or annual churn rates for rich and actionable insights.
Conducting long-term rate analysis allows you to gather substantial data to make any sense of it.
Customer Churn vs. Revenue Churn Rate
| Customer Churn Rate | Revenue Churn Rate |
|---|---|
| The number of customers you lost. | The amount of revenue you lost. |
| Total Number of Churned Customers ⸺⸺⸺⸺⸺⸺⸺⸺ Total Number of Customers |
MRR lost in the last 30 days ⸺⸺⸺⸺⸺⸺ MRR 30 days ago x 100 Do not include additional revenue from existing customers and new sales in the month. |
FREE. All Features. FOREVER!
Try our Forever FREE account with all premium features!
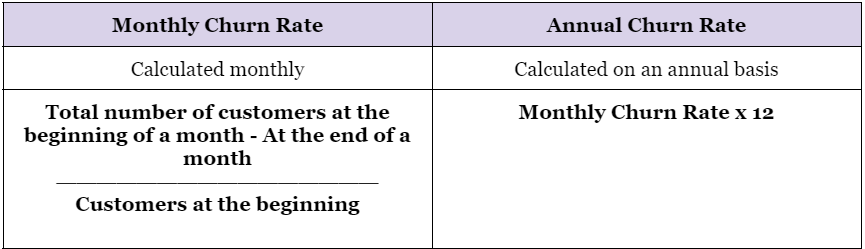
Monthly Churn Rate vs. Annual Churn Rate
Calculate Churn Rate to Achieve Higher Retention
A higher retention rate translates into higher revenue, and who doesn’t want that. So, start by calculating your churn rate and identify any recurring trends or patterns to take corrective actions.
Now, the churn rate alone won’t get you anywhere. You need to know the reasons behind customers leaving your business.
For this, you can use customer feedback software and gather feedback at the right time, right place, and from the right people. Once you have this down, positive results are inevitable.
FREE. All Features. FOREVER!
Try our Forever FREE account with all premium features!
 We'd love your feedback!
What did you like & how can we make it even better?
 Thanks for your feedback!
 Ask Your Question
Have a question? Get expert help to make your decision easier.