
If your NPS looks stable, but customers keep churning, or your CSAT scores are acceptable, but support ticket volume keeps climbing, the problem probably is not satisfaction. It is the effort.
Customer success managers, product teams, and CRO leads who search for customer effort score are usually dealing with a specific gap.
They can measure how customers feel, but not where the experience is breaking down.
CES closes a specific part of that gap. It tells you which touchpoints are generating friction, and friction is one of the clearest leading indicators of churn. Paired with NPS and behavioral data, it gives you the full picture.
This guide covers what CES is, how to calculate it, how to run CES surveys using Qualaroo’s Nudge™ technology, which questions to use, and how to turn your scores into friction-reduction actions that move retention metrics.
Let’s get into it.
What Is Customer Effort Score?
Customer Effort Score (CES) is a CX metric that measures how easy or difficult it was for a customer to complete a specific interaction with your company. It is captured via a single survey question on a 5-point or 7-point scale, triggered immediately after a touchpoint such as a support resolution, onboarding step, or purchase.
CES was introduced by CEB (now Gartner) in a 2010 Harvard Business Review article that showed that reducing customer effort, not delighting customers, actually drives loyalty.
The original question asked customers to rate the effort they personally had to put in.
CES 2.0, the current standard, reframes it as a company responsibility statement:
“The company made it easy for me to handle my issue.”
That framing change is worth noting. When the company owns the ease, customers respond more honestly and consistently, and the data becomes a lot cleaner to act on.
A high CES score on an ease scale means low effort. A low score means friction. That friction is a strong early warning signal for churn, often surfacing before it registers in your NPS or CSAT data.
How Do You Measure Customer Effort Score?
There are two calculation methods. Most teams use both: one for internal tracking, one for stakeholder reporting.
Method 1: Average Score
Add all individual responses and divide by the total number of respondents.
| CES = Sum of all scores / Total number of respondents |
Example: 9 responses of 5, 3, 6, 4, 7, 2, 6, 5, 4
Sum = 42. CES = 42 / 9 = 4.7 out of 7.
Use this for tracking trend changes over time with numerical precision.
Method 2: Percentage Positive (Recommended for Reporting)
Divide respondents who selected “Easy” or higher (5, 6, or 7 on a 7-point scale) by the total number of respondents.
CES% = (Positive responses / Total responses) x 100
Example: 88 out of 100 chose 5, 6, or 7. CES% = 88%.
This is the method to present to leadership. “88% of customers found this easy” lands immediately, whereas “4.7 out of 7” does not.
Which Scale Format Should You Use?
| Scale | Best For | Trade-Off |
|---|---|---|
| 7-point Likert (standard) | Maximum sensitivity, benchmarkability | Slightly more cognitive load |
| 5-point Likert | Mobile-first, faster completion | Less granularity |
| Emoji / Emoticon | In-chat, non-English audiences | Limited nuance in data |
Pick one format and commit to it across all your CES surveys. Switching formats mid-program makes your trend data unreliable.
Here are a few customer feedback tools you can use to improve the CES frictions:
How Do You Run CES Surveys With Qualaroo?
The most common failure in CES programs is not the question; it is the timing and delivery.
If you send a CES survey hours after an email interaction, you are asking someone to reconstruct how they felt. The memory degrades. The response is less accurate.
This is where the way you collect CES matters as much as what you ask.
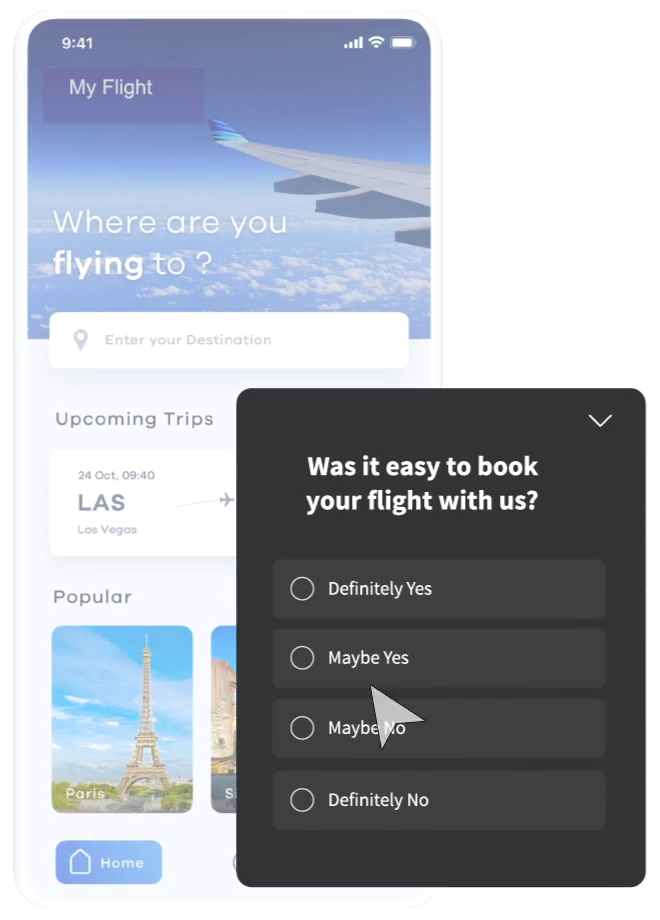
Qualaroo’s Nudge™ technology triggers surveys in-context: inside your app, on your website, or in your chat window, at the exact moment the interaction completes.
You are capturing how the experience felt while the customer is still in it. That is the signal you need.
In Hootsuite’s case, using Qualaroo’s in-context approach delivered a 16% lift in conversion at 98% statistical significance, a result that passive email surveys were not producing.
Here is how to set up a CES program in Qualaroo:
1. Map the Touchpoints: Identify where customers complete tasks or contact support.
Start with one or two high-frequency touchpoints: support ticket resolution, onboarding step completion, or checkout.
2. Build the Survey: Use the standard CES template as your first question.
Add a branching open-ended follow-up based on score range: low scores ask what went wrong, high scores ask what worked.
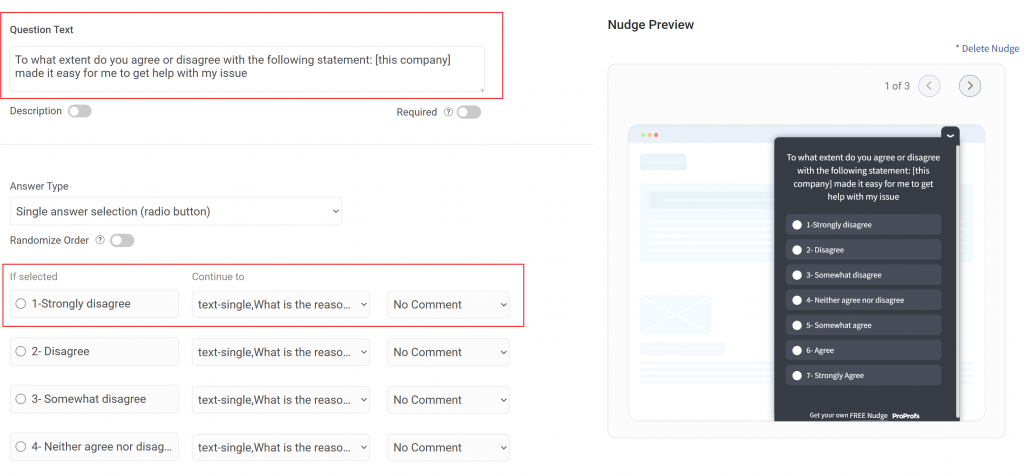
3. Configure the Trigger: In Qualaroo, set the Nudge™ to fire based on a URL pattern, a specific user action, a cookie value, or session behavior.
For support, trigger at ticket close. For onboarding, trigger after the first key action is confirmed complete.
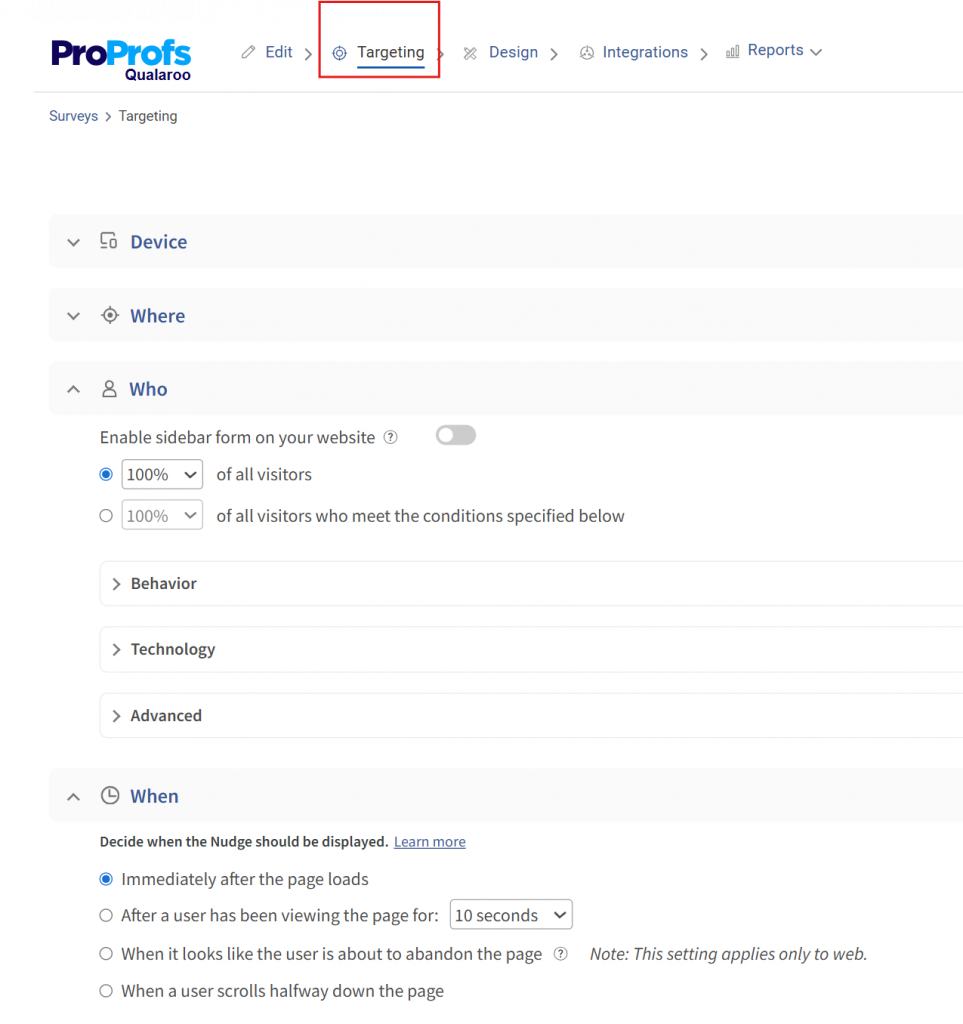
4. Set Alerts for Low Scores: Configure automated alerts for any score of 1 or 2 on a 7-point scale.
Low CES scores need a human response within 24 to 48 hours, not just a data point in a dashboard.
5. Review Results in Aggregate: Use Qualaroo’s built-in AI Sentiment Analysis to automatically categorize open-ended follow-up responses.
This surfaces friction themes without requiring you to read every comment manually.
6. Act and Iterate: Fix the top friction point identified in each review cycle. Measure again. If the score improves, the fix worked. If not, go deeper.
What CES Survey Questions Should You Ask?
Good CES questions are task-specific and neutral. They focus on ease, not satisfaction, speed, or agent quality.
For a deeper bank of options, see our full customer effort score survey question guide.
Core CES Question (Use This as Your Default)
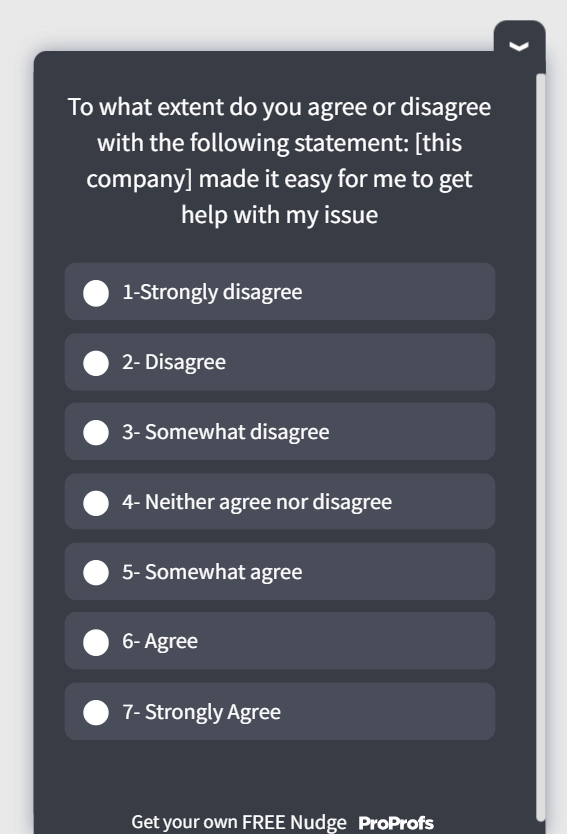
“The company made it easy for me to handle my issue.” Scale: 1 (Strongly Disagree) to 7 (Strongly Agree)
Here’s a quick CES template for you:
By Touchpoint
Support and Service
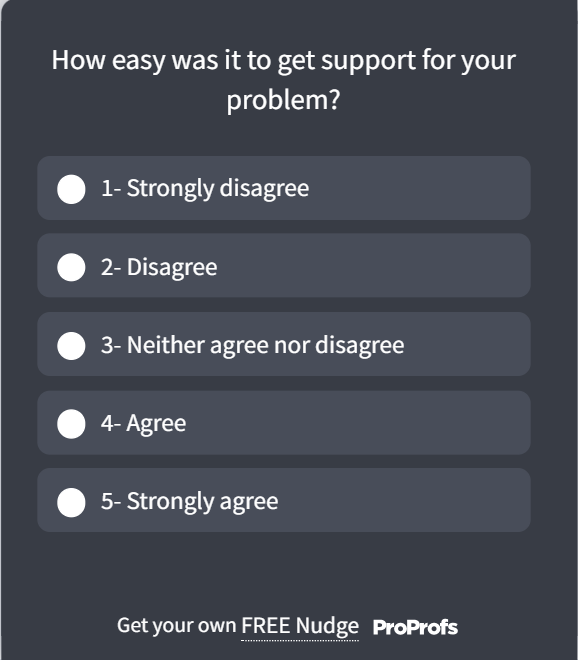
- “How easy was it to get your issue resolved today?”
- “How easy was it to reach our support team when you needed them?”
Here’s a support CES template for you:
Onboarding
- “How easy was it to get started with [product]?”
- “How easy was it to complete your account setup?”
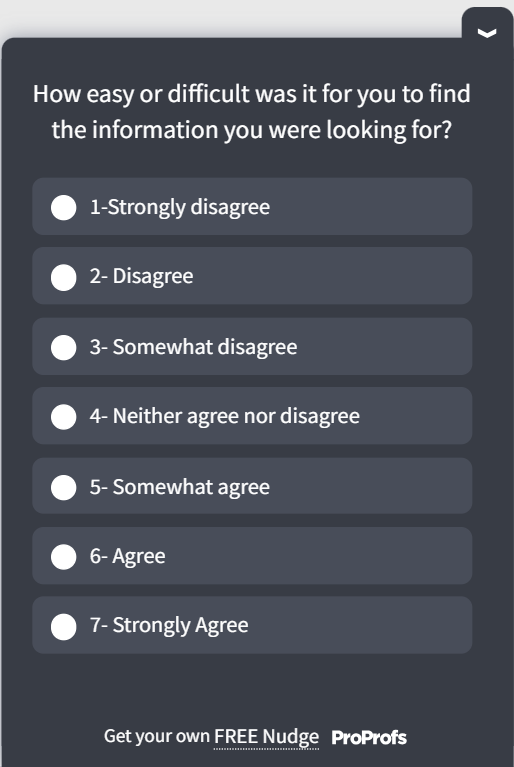
Self-Service and Help Center
- “Were you able to find what you were looking for?”
- “How easy was it to navigate our help resources?”
Here’s a self-service CES template for you:
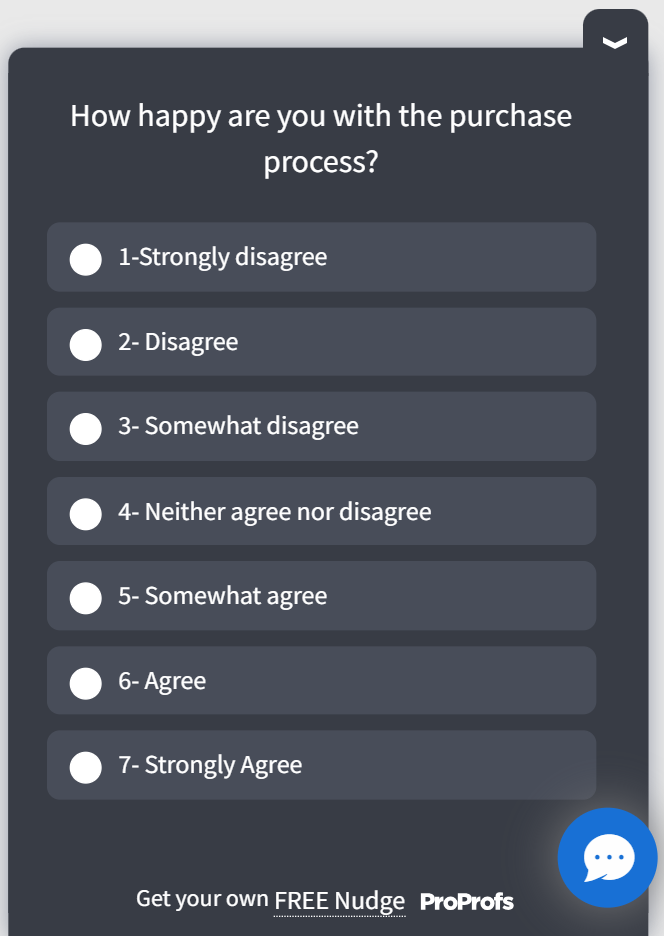
Checkout and Purchase
- “Was it easy to complete your purchase today?”
- “How easy was it to find the product you were looking for?”
Here’s a quick post-purchase template to help you:
Always Include a Follow-Up Question
If score is 1 to 3: “What could we have done to make this easier for you?” If score is 5 to 7: “What made this experience easy for you?”
The rating tells you something is broken. The follow-up tells you what to fix. Without it, you are auditing without a location.
Callout Box: Ready-to-Use CES Survey Template
Q1: “The company made it easy for me to resolve my issue.” Scale: 1 (Strongly Disagree) to 7 (Strongly Agree)
Q2 (shown if Q1 = 1 to 3): “What could we have done to make this easier?” Open text
Q2 (shown if Q1 = 5 to 7): “What did we do well that made this easy?” Open text
FREE. All Features. FOREVER!
Try our Forever FREE account with all premium features!
How Do You Benchmark and Improve Your CES Score Over Time?
Chasing a universal CES benchmark is a distraction.
Published industry averages are inconsistent because scale format, question phrasing, and survey timing all vary too much to make meaningful cross-company comparisons.
What actually moves your retention numbers is internal benchmarking: setting a baseline, tracking by touchpoint, and measuring the impact of specific changes.
Set a 60-Day Baseline First
Run CES at your top two or three touchpoints for 60 days before trying to improve anything. You need to know where you are before you can measure whether you have moved.
Survey Frequency, Sample Size, and Fatigue Guidelines
CES is a triggered metric, not a scheduled one. You run it after a specific interaction completes, not on a recurring calendar cadence. That distinction keeps it high-signal and low-fatigue.
A few practical guardrails:
Survey Frequency: Set a suppression window of 7 to 14 days per user. If someone has already received a CES survey this week, don’t trigger another one regardless of how many interactions they complete. Most platforms including Qualaroo let you set this at the Nudge™ level.
Sample Size: For a touchpoint that gets fewer than 50 completions per month, wait until you have at least 30 to 40 responses before drawing conclusions. Under that threshold, a few outlier scores will skew your average significantly.
Response Rates: According to Simplesat’s 2025 study, Customer Effort Score (CES) surveys typically yield an average response rate of 15% to 20%. However, “good” performance is generally considered anything exceeding 30%. If your rate drops, check for suppression conflicts, timing issues, or survey placement before assuming low engagement.
Survey Fatigue: Keep your CES survey to two questions maximum: the rated scale question and one open-ended follow-up. Anything beyond that belongs in a separate research study, not a transactional feedback trigger.
Track by Touchpoint, Not Overall
A single aggregate CES score hides more than it reveals.
A support CES of 82% alongside an onboarding CES of 51% is a very different problem from sitting at 65% on both. Segment your scores and prioritize accordingly.
Here is how this plays out in practice.
A SaaS company running CES across three touchpoints might see a healthy 84% in post-support interactions and a respectable 79% at checkout, but only a 48% in onboarding completion.
Without segmenting by touchpoint, that 48% is buried in an overall average that looks acceptable.
With it, the team knows exactly where to look: the setup guide, the first login experience, or the first time a user tries a core feature.
That is the investigation that prevents month-two churn.
Pair CES With Operational Metrics
| CES Signal | Operational Metric to Cross-Reference |
|---|---|
| Low post-support CES | First Contact Resolution (FCR) rate |
| Low onboarding CES | Time-to-first-value, drop-off points |
| Low help center CES | Search exit rate, ticket volume on the same topics |
| Low checkout CES | Cart abandonment rate, payment error logs |
When CES drops, the paired operational metric usually tells you why.
Act on Low Scores Within 24 Hours
CX research consistently shows that customers who receive a timely follow-up after a negative experience are more likely to return and less likely to escalate.
For example, customers are 2.4 times more likely to stick with a brand when their problems are solved quickly (Forrester 2021 study). The principle holds across satisfaction and effort metrics: speed of response matters more than the content of the response.
Belron, the company behind Safelite and Autoglass, used Qualaroo surveys at key booking touchpoints to capture in-context effort signals rather than relying on post-process feedback alone.

Exit-intent surveys revealed why visitors left before booking, even when their need was obvious.
That insight helped Belron restructure both their messaging and UX, maintaining a strong NPS while removing friction that would never have surfaced in a satisfaction-only survey program.
Ready to Find Where Your Customers Are Struggling?
Most teams already have enough data to know customers are struggling. What they are missing is the specific location of the friction.
A CES program gives you that location, touchpoint by touchpoint, in the customer’s own words, at the moment it actually happened.
You do not need a full CX transformation to start.
Pick the one interaction that generates the most repeat contacts or the most drop-offs. Use Qualaroo for your CES surveys. Run it for 30 days.
The first friction point you find and fix will be more valuable than any satisfaction score you have ever reported.
Frequently Asked Questions
Why is CES often a stronger leading indicator of loyalty than CSAT?
CES surfaces friction before it compounds into dissatisfaction, which is why it tends to catch retention risk earlier than CSAT. That said, it works best alongside NPS and behavioral data. A low CES tells you where the experience broke down; NPS and churn data confirm whether it cost you the relationship.
How is CES different from CSAT?
CES measures how easy the interaction was. CSAT measures how satisfied customers are. Both can diverge: a professional agent still produces a high-effort score if the customer had to call back twice or repeat their account number. Use CES for process friction, CSAT for interaction quality.
When should you deploy a CES survey?
Immediately after the interaction, you are measuring. For live chat, show it in the window at session close. For support tickets, trigger within 30 minutes of resolution. For onboarding, fire after a specific action is confirmed complete. Response quality degrades significantly after 24 hours.
Can CES help reduce SaaS churn?
Yes, and the revenue case is direct. OnRamp's 2026 State of Onboarding Report (161 CS leaders) found that 57% of companies that cut onboarding investment saw churn rise within six months, and 57% of leaders tie onboarding friction directly to delayed revenue realization. Companies that reduced friction saw 30 to 70% faster onboarding times, with one customer recognizing revenue an average of three months sooner.
How many questions should a CES survey have?
A rating question and one open-ended follow-up. The rating gives you the score. The follow-up gives you the context to act on it. Adding more questions increases abandonment and produces noisier data.
How do you measure CES across the customer journey, not just support?
Deploy CES after each stage where customers complete a meaningful task: onboarding, self-service, checkout, and renewal. Each touchpoint has a different friction profile. A low onboarding score points to documentation gaps. A low checkout score points to UX or payment friction.
What is the CES 2.0 question format?
CES 2.0 uses a company-responsibility statement: "The company made it easy for me to handle my issue," rated on a 7-point scale from Strongly Disagree to Strongly Agree. This replaced the original self-assessment format ("How much effort did you put in?") and produces more consistent, cross-market results.
FREE. All Features. FOREVER!
Try our Forever FREE account with all premium features!
 We'd love your feedback!
What did you like & how can we make it even better?
 Thanks for your feedback!
 Ask Your Question
Have a question? Get expert help to make your decision easier.