

A customer satisfaction survey is a structured set of questions that measures how well your product, service, or support experience met a customer’s expectations. Companies use them to collect targeted feedback at specific moments in the customer journey, from post-purchase to post-support, so they can identify gaps, track trends, and make decisions grounded in real customer data rather than internal assumptions.
A customer satisfaction survey is only as good as the questions inside it. Ask the wrong ones, and you get data that looks complete but tells you nothing useful.
Ask the right ones at the right moment, and you get a direct line into what your customers actually think, feel, and need.
This guide gives you:
- A ready-to-use question bank organized by use case
- A practical framework for choosing the right metric
- Scale guidance so your data is actually reliable
- A measurement loop that turns feedback into action
Every question includes the metric it measures, the touchpoint it belongs to, and the scale that produces reliable data.
What Are the Best Customer Satisfaction Survey Questions for Each Use Case?
The quality of your feedback depends almost entirely on whether you are asking the right question at the right touchpoint.
- A question about overall brand satisfaction does not belong on a post-support email.
- A question about feature usability does not belong on a checkout confirmation page.
Here is a question bank organized by the four most common use cases. Pick the ones that match where your customer is in their journey:
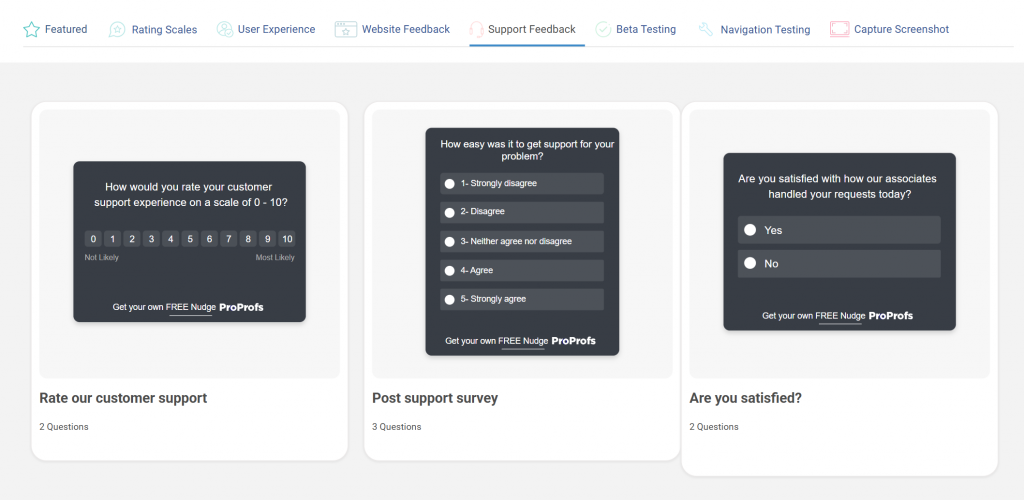
Which Questions Measure Post-Support Satisfaction?
These questions are best triggered immediately after a support ticket closes, a chat ends, or a call completes. The goal is to measure resolution quality, ease, and communication, not general brand sentiment.
| # | Question | What It Measures |
|---|---|---|
| 1 | How would you rate the support you received today? | Overall support satisfaction |
| 2 | Was the representative able to fully resolve your issue? | Resolution effectiveness |
| 3 | How easy was it to get your problem resolved? | Customer effort in support |
| 4 | Were you kept informed throughout the support process? | Communication quality |
| 5 | How satisfied are you with the time it took to resolve your issue? | Response and resolution speed |
| 6 | Did you feel comfortable communicating with the support representative? | Rapport and agent tone |
| 7 | Please rate the overall quality of support you received. | Holistic support quality |
| 8 | Was your issue resolved in a way that met your expectations? | Expectation vs. reality gap |
| 9 | What could we have done differently to improve your experience? | Qualitative improvement signals |
| 10 | What did you appreciate most about your interaction with our team? | Positive experience drivers |
| 11 | Did you have to contact us more than once to resolve this issue? | First contact resolution rate |
| 12 | How knowledgeable was the support representative? | Agent competence |
| 13 | Were you offered a clear next step or solution during your interaction? | Clarity and guidance quality |
| 14 | Did the representative listen carefully to your concern? | Active listening and empathy |
| 15 | How likely are you to reach out to our support team again if needed? | Confidence in support reliability |
Tip: Pair one scored question (How easy was it to resolve your issue? on a 1 to 5 scale) with one open-ended follow-up for scores of 3 or below. You get the number and the “why” without making the survey feel like homework.
Here are a few post-support templates you can use to gauge customer satisfaction:
Which Questions Reveal Customer Loyalty?
Loyalty questions measure long-term relationship health, not a single interaction. Use these in quarterly pulse surveys, post-renewal flows, or after a significant product milestone.
| # | Question | What It Measures |
|---|---|---|
| 1 | How likely are you to recommend us to a friend or colleague? (0 to 10) | Net Promoter Score (NPS) |
| 2 | Would you continue using our product if a cheaper alternative became available? | Price-independent loyalty |
| 3 | To what extent does our product meet your expectations? | Expectation fulfillment |
| 4 | How would you feel if you could no longer use our product? | Product dependency and attachment |
| 5 | How would you rate the overall value you get for what you pay? | Perceived value for money |
| 6 | Have you referred anyone to us in the last 90 days? | Actual referral behavior |
| 7 | How strongly do you feel connected to our brand? | Emotional brand attachment |
| 8 | Is there anything we could do to make you a stronger advocate for us? | Advocacy gap and growth potential |
| 9 | How frequently do you use our product or service? | Engagement and usage depth |
| 10 | Do you plan to continue using our product in the next 12 months? | Retention intent |
| 11 | How does our product compare to alternatives you have tried? | Competitive differentiation |
| 12 | Have you purchased additional products or plans from us? | Expansion and upsell behavior |
| 13 | Would you try a new product or feature we launched? | Openness to brand extension |
| 14 | How well do our brand values align with your own? | Value alignment and brand fit |
Note on NPS: The standard NPS formula subtracts all Detractors (0 to 6) from Promoters (9 to 10) and ignores Passives (7 to 8). That math is intentionally aggressive. A score of +30 to +50 is considered strong for most SaaS companies. Below +10 warrants a close look at churn patterns.
Here’s an NPS survey template you can simply use to gauge loyalty:

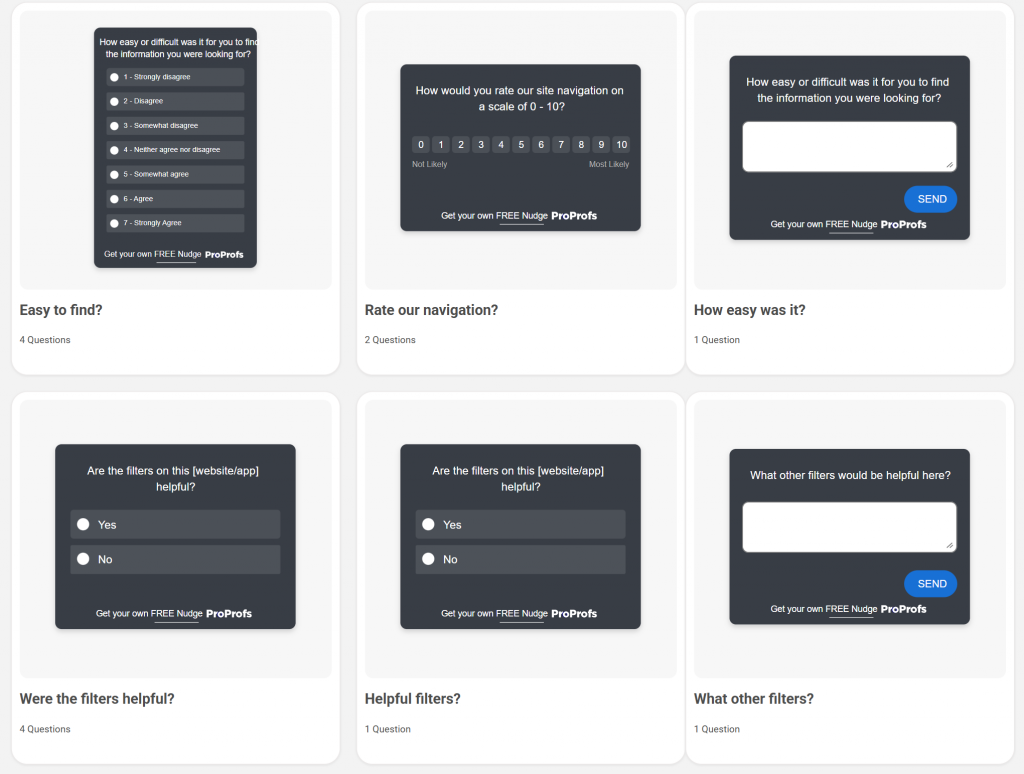
Which Questions Uncover Website or Product Experience Issues?
Use these for in-product nudges, post-session feedback, or exit surveys. They are designed to surface usability friction before it turns into churn.
| # | Question | What It Measures |
|---|---|---|
| 1 | Was the page or feature easy to navigate? | Navigation usability |
| 2 | Did you find what you were looking for? | Information discoverability |
| 3 | On a scale of 1 to 5, how intuitive was this experience? | Overall UX intuitiveness |
| 4 | Did you encounter any technical issues or errors? | Technical reliability |
| 5 | Was the content on this page clear and relevant to what you needed? | Content relevance and clarity |
| 6 | Were the instructions or labels easy to understand? | Microcopy and label clarity |
| 7 | Are there any features you expected to find but did not? | Feature expectation gaps |
| 8 | Would you return to this section of the product? | Return intent and satisfaction |
| 9 | How satisfied are you with the range of features available? | Feature completeness |
| 10 | Was the page quick to load and responsive? | Performance and technical experience |
| 11 | Did the product experience match what was described or promised? | Expectation vs. delivery alignment |
| 12 | Were you able to complete the action you came here to do? | Task completion rate |
| 13 | What is the one thing that would make this experience significantly better? | Top friction or improvement signal |
Here are a few website satisfaction feedback templates you can use:
What Open-Ended Questions Actually Uncover Customer Sentiment?
Scored questions tell you where the problem is. Open-ended questions tell you what it is.
Use one open-ended question per survey. Put it last. Trigger it only for low scores or for users in an exit flow. Here are five formats that work:
| # | Question | What It Measures |
|---|---|---|
| 1 | What almost stopped you from completing this? | Friction points and drop-off triggers |
| 2 | What would make this experience a 10 for you? | Improvement ceiling and unmet expectations |
| 3 | Tell us more about what happened during your recent interaction. | Unfiltered experience narrative |
| 4 | What is the one thing we could improve to better serve you? | Top priority improvement signal |
| 5 | What would you like to see added or changed in the next version? | Product roadmap and feature intent |
| 6 | What made you choose us over other options? | Key decision drivers and differentiators |
| 7 | What is working well that you would not want us to change? | Satisfaction anchors and strengths |
| 8 | What does a perfect experience with our product look like to you? | Ideal state and expectation mapping |
| 9 | Is there anything about our product or service that has surprised you, positively or negatively? | Unmet or exceeded expectations |
| 10 | If you could give our team one piece of advice, what would it be? | Direct, unfiltered customer voice |
Keep the prompt short and the text box open. Do not offer suggested answers. You want the customer’s words, not a selection from your assumptions.
How Do You Create a Customer Satisfaction Survey in Qualaroo?
Plenty of tools let you build a satisfaction survey.
The reason Qualaroo works better for in-context customer satisfaction feedback is that it does not disrupt the customer’s experience. No separate survey link, no email follow-up three days later, no third-party redirect.
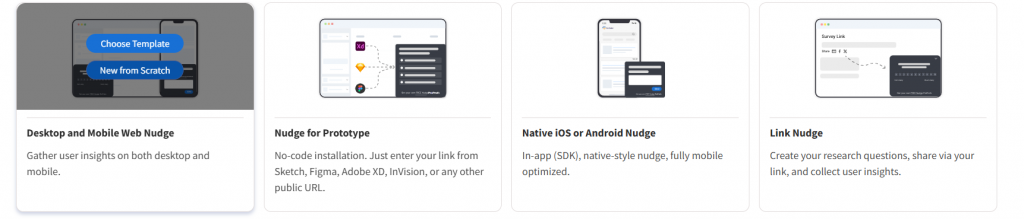
Qualaroo runs surveys as “Nudges,” small, targeted prompts that appear directly on your website or within your product, without redirecting the user.
Here is how to set one up from scratch:
How Do You Set Up Your First Nudge?
Step 1: Start a New Survey
Log in to your Qualaroo dashboard, then click “Create a Nudge” in the top-right corner.
Step 2: Choose Your Channel
Select the channel where you want the survey to appear. For website feedback, choose Desktop Web. If you want a persistent option that customers can open on their own terms, Sidebar Form is a good choice.
Then choose between:
- “New From Scratch” if you want full control over every question
- “Choose Template” if you want a pre-built starting point (Qualaroo has ready-made templates for CSAT, NPS, and website feedback)
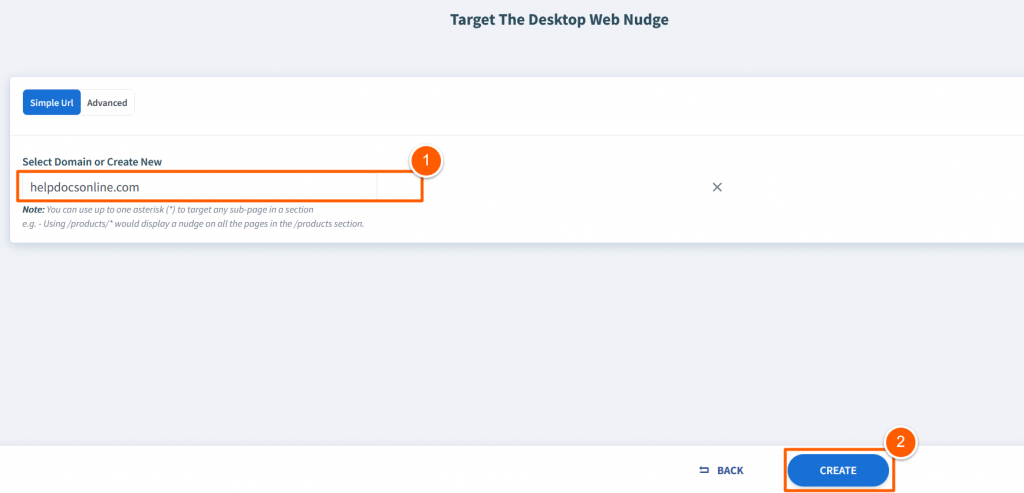
Step 3: Set Your Target Domain
Enter the domain where the Nudge will run, for example, yoursite.com. Click “Create” to open the editor.
How Do You Build and Customize Your Survey Questions?
Step 1: Name Your Survey
Give it a name that is specific enough to identify it in your dashboard later. “Post-Support CSAT Q2” is more useful than “Survey 1.”

Step 2: Edit the Default Question
The editor opens with a preset question and a welcome message. Replace these with your actual survey question. Keep it to one scored question upfront.
Step 3: Configure Each Question
For every question you add:
- Write the question text in plain, neutral language
- Add a short description if the question needs context
- Mark it as required if you need an answer before the customer can move forward
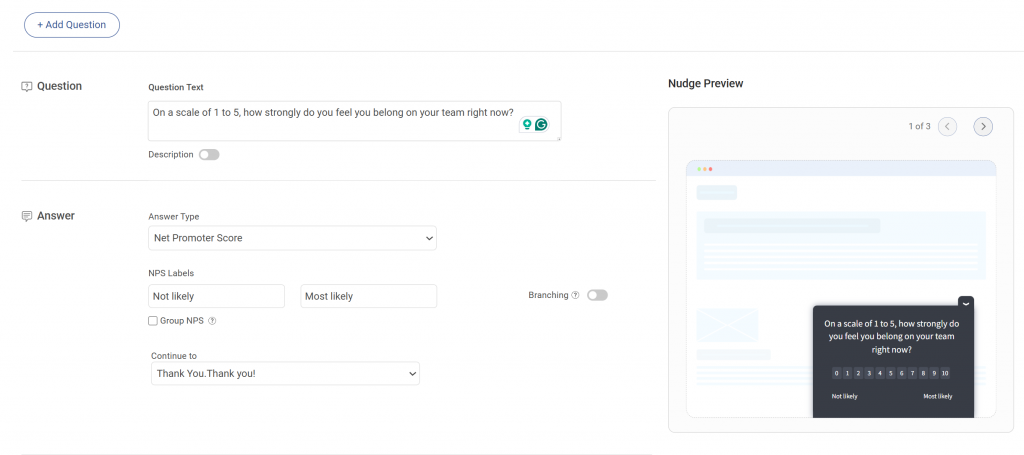
Step 4: Choose the Right Answer Format
Qualaroo supports multiple response types. Match the format to what you are trying to measure:
| Answer Type | Best Used For |
|---|---|
| NPS (0 to 10) | Loyalty and referral likelihood |
| Star or emoji rating | Quick post-interaction CSAT |
| Likert scale | Nuanced agreement or effort questions |
| Single or multiple choice | Segmentation and behavioral questions |
| Free text (open-ended) | Qualitative follow-up for low scores |
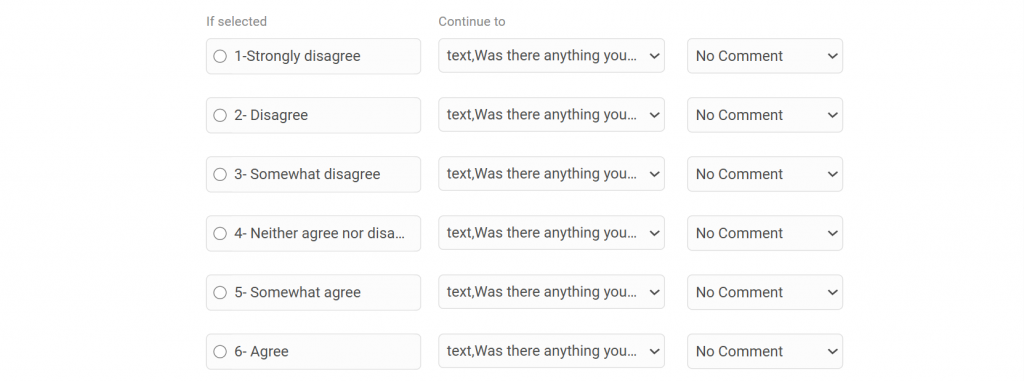
Step 5: Add Branching Logic
This is where most teams leave value on the table. Branching lets you show a follow-up question only when it is relevant.
For example, if a customer scores you 3 or below on CSAT, a follow-up asking “What went wrong?” appears automatically. Customers who score 9 or 10 can be redirected to leave a review instead.
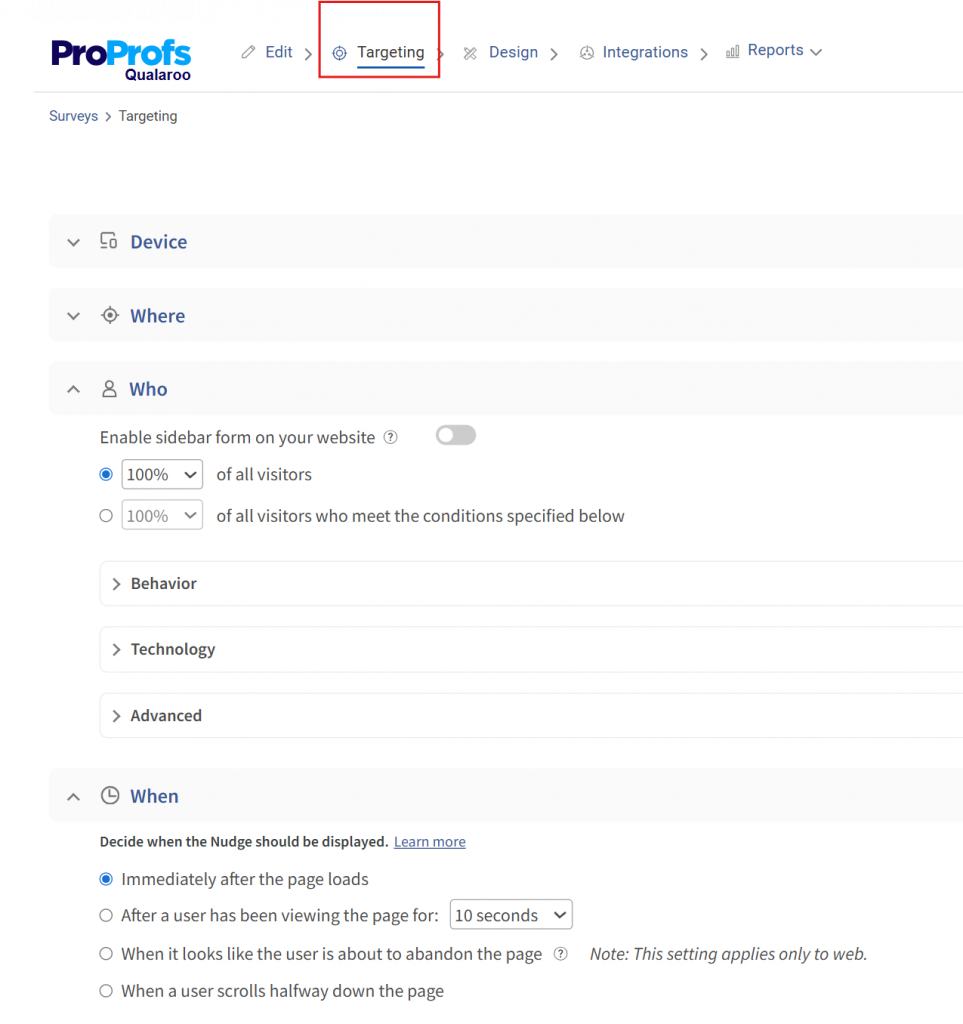
How Do You Target the Right Customers at the Right Moment?
Once the survey is built, move to the targeting settings. This is what separates a useful survey from one that fires at random.
You can control:
- Which pages the Nudge appears on (post-checkout, support confirmation page, feature page)
- Which users see it (by plan type, behavior, device, or session data)
- When it triggers (after a set time on page, on exit intent, after a specific action)
- How often does it show to the same user
Set these conditions before you activate. A CSAT survey that fires on your homepage to every visitor is not a CSAT survey. It is noise.
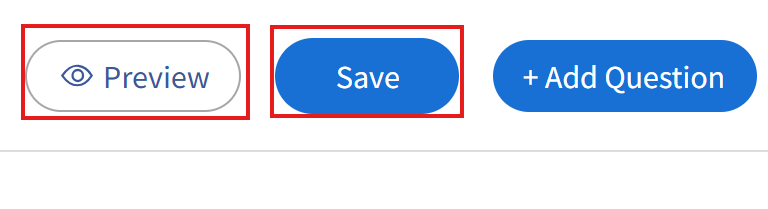
Once targeting is configured, preview the Nudge to check how it looks on desktop and mobile, then activate it. Your first response can come in within minutes of going live.
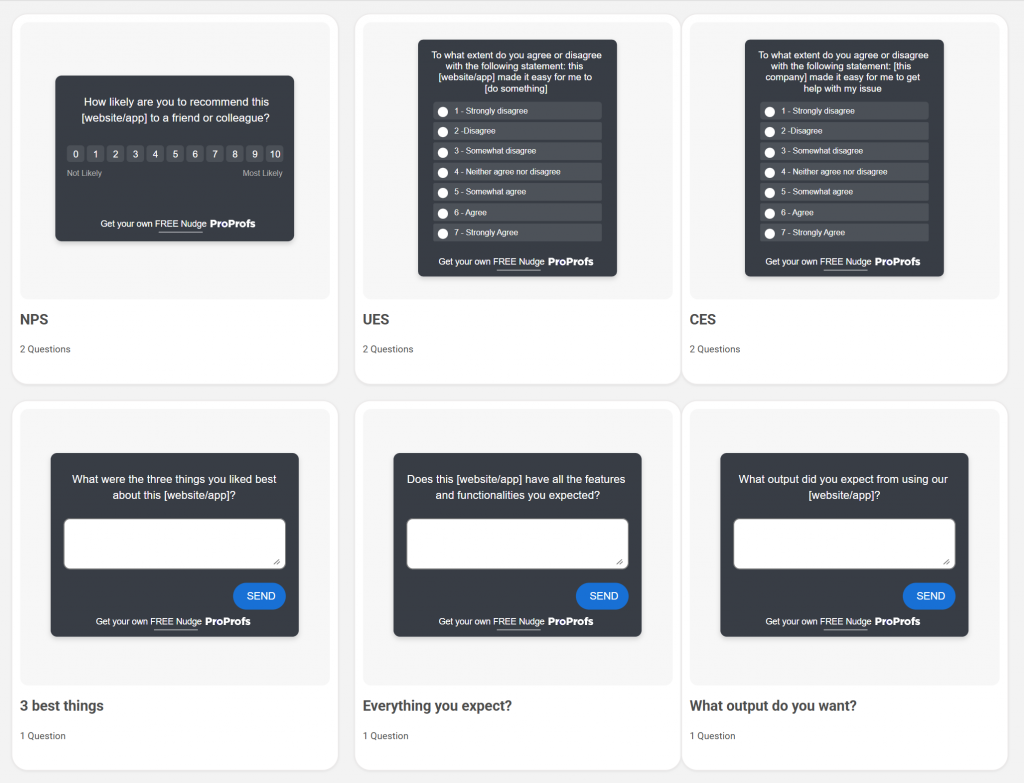
How Do CSAT, NPS, and CES Questions Differ?
Three metrics, three distinct jobs. Many teams run all three interchangeably and end up with data that contradicts itself. Here is how to use each one correctly.
CSAT (Customer Satisfaction Score) measures satisfaction after a specific interaction. It is short-term and transactional. Best used after support interactions, purchases, or onboarding steps.
NPS (Net Promoter Score) measures the likelihood that a customer will recommend you. It is a long-term loyalty signal, not a satisfaction gauge. Best used in quarterly relationship surveys or post-renewal flows.
CES (Customer Effort Score) measures how easy it was for a customer to get something done. It predicts churn better than CSAT in many service contexts because friction, not dissatisfaction, is often the real driver of customer loss.
| Metric | What It Measures | Best Timing | Recommended Scale | Sample Question |
|---|---|---|---|---|
| CSAT | Satisfaction with a specific interaction | Immediately post-interaction | 1 to 5 | "How satisfied are you with the support you received?" |
| NPS | Long-term loyalty and advocacy | Quarterly or post-renewal | 0 to 10 | "How likely are you to recommend us to a friend or colleague?" |
| CES | Ease of completing a task or resolving an issue | Post-support or post-task | 1 to 7 | "How easy was it to get your issue resolved?" |
One important pattern to watch: on a 1 to 10 scale, many respondents treat anything below a 7 as a failing grade, reflecting how most people are conditioned by academic scoring.
This creates grade inflation in your data. A score of 7 often means “fine, not great,” but gets treated as acceptable. Using a 1 to 5 or 1 to 7 scale reduces this distortion.
What Scale Should You Use for Customer Satisfaction Ratings?
Scale selection is not cosmetic. It directly affects how accurately your data reflects what customers actually feel, how easy the survey is to complete, and how your scores compare to industry benchmarks.
Here is a practical decision table:
| Scale | Best For | Strengths | Watch Out For |
|---|---|---|---|
| Binary (thumbs up/down or emoji) | Mobile, quick post-interaction | Highest response rate, least friction | No nuance, hard to diagnose the root cause |
| 1 to 5 | General CSAT, mobile-first surveys | Simple, fast, easy to benchmark | Limited range for nuanced feedback |
| 1 to 7 | CES, detailed experience surveys | Clear midpoint (4), enough range without overwhelm | Less familiar to respondents |
| 0 to 10 | NPS only | Industry standard, enables Promoter/Detractor math | Grade inflation, respondents cluster around 7 to 9 |
Social scientists generally recommend a 1–7 scale for nuanced measurement. It has a genuine neutral midpoint, gives respondents enough room to differentiate their experience, and avoids the cognitive overload of a 10-point range.
For mobile surveys or quick post-chat pops, binary or 1 to 5 is the better call because you want the response, not the precision.
FREE. All Features. FOREVER!
Try our Forever FREE account with all premium features!
How Do You Build a Satisfaction Measurement Framework That Actually Closes the Loop?
Most teams collect CSAT scores and stop there. The score goes into a dashboard, gets presented in a weekly meeting, and then nothing changes. That is the gap between measuring satisfaction and improving it.
Here is a seven-step loop that actually produces outcomes:
1. Ask: Trigger one relevant survey at one key moment. Use the right metric for that moment (CSAT post-support, NPS post-renewal, CES post-onboarding). Keep it to one scored question plus an optional open-text follow-up for low scores.
2. Segment: Break your results by customer type, plan tier, product area, or support channel. A CSAT score of 78% overall might be 91% for enterprise customers and 61% for SMB customers. Averages hide the real story.
3. Compare to Benchmark: The global average CSAT across industries is 75% to 85%. SaaS specifically tends to run between 78% and 82%. If you are below 70%, you have a structural issue. If you are above 85%, you are either doing something right or your survey design is too easy to answer positively.
4. Diagnose the Gap: Pull the open-text responses for your lowest-scoring segment. Look for patterns in language, not individual complaints. Three customers independently mentioning “slow response time” is a signal. One customer mentioning it is feedback.
5. Prioritize Fixes: Not every satisfaction gap is worth solving immediately. Use a simple 2×2: impact on retention vs. effort to fix. Start with high-impact, low-effort improvements. This is where Qualaroo’s segmentation and analytics features make the diagnostic step faster: you can filter by audience, page, or interaction type and see where friction concentrates.
6. Act: Make the change. This seems obvious, but many feedback loops stall here because the findings never get routed to the right team. Set up real-time alerts for low scores so the right person sees it immediately, not in next quarter’s review.
7. Re-Measure: Run the same survey at the same touchpoint three to four weeks after the fix. If the score moves, the change worked. If it does not, you either fixed the wrong thing or the fix was not enough. Either way, you have a direction.
This loop only works if every step feeds the next one. Skipping the segmentation step means your fixes are aimed at an average customer who does not actually exist.
How Do You Select the Right Questions Without Asking Too Many?
The fastest way to kill your response rate is a long survey. Most customers will drop off after three to five questions. So the question is not “what do I want to know?” but “what is the one thing I need to know right now?”
Use this checklist before finalizing any customer satisfaction survey:
How Do You Know If Your Survey Questions Are Actually Ready?
Before you activate, run through this five-point checklist.
1. Does each question serve one clearly defined objective?
Ask yourself: “What decision will this answer help me make?” If you cannot answer that in one sentence, cut the question. If a question covers two objectives, split it or drop the weaker one.
2. Is every question tied to a specific touchpoint or lifecycle stage?
A new customer and a two-year customer are in completely different places. Sending them the same survey produces data that accurately describes neither. Map each question to a stage before finalizing:
| Lifecycle Stage | Right Questions to Ask |
|---|---|
| Post-signup or onboarding | Was the setup easy? Were the getting-started resources helpful? |
| Post-support | Was your issue resolved? How easy was the process? |
| Post-purchase | How satisfied are you with your purchase experience? |
| Quarterly check | How likely are you to recommend us? How well does the product meet your needs? |
| Pre-churn or exit | What is the primary reason you are leaving? What would have made you stay? |
If a question does not fit the stage, remove it and save it for the right moment.
3. Have I removed any double-barreled questions?
A double-barreled question asks two things at once, making responses impossible to interpret. Read every question out loud. If you pause at the word “and,” you likely have one.
4. Is my open-ended question at the end, not the beginning?
Open-ended questions take the most effort. Leading with one will kill your completion rate. Always put it last, trigger it only for low scorers using branching logic, and never make it required. One open-ended question per survey is enough.
5. Would a customer complete this survey in under 90 seconds?
Most customers will not give you more than 90 seconds. Use this as a quick time check:
If your survey exceeds four or five questions, it is too long. Cut to the one thing you most need to know right now.
A few additional principles worth following:
- Align to lifecycle stage. A customer in their first 30 days needs onboarding feedback questions. A customer in renewal needs loyalty and value questions. Sending the same survey to both produces noise, not insight.
- Balance scored and open-ended questions. One scored question gives you a number to track. One optional open-text follow-up gives you the context to act on it. That is the right ratio for most surveys.
- Avoid leading language. “How much did you enjoy our support?” assumes the customer enjoyed it. “How would you rate your support experience?” does not. The difference in response quality is significant.
What Do Industry Benchmarks Say About CSAT Scores?
Numbers without context are just numbers. Here is how CSAT, NPS, and CES benchmarks actually break down across industries so you can calibrate where your scores sit.
CSAT bar
NPS range bar
A few signals worth knowing:
- A CSAT below 70% typically indicates a repeating process failure, not random bad days.
- An NPS below +10 is a warning sign, especially for subscription businesses where retention is the primary growth driver.
- The Sean Ellis benchmark offers a different lens: if fewer than 40% of your users say they would be “very disappointed” if your product went away, you have not yet hit product-market fit. That is a satisfaction signal at a deeper level than any CSAT score.
Expert Note: According to Nthabi Choma, Research Operations Manager at Twilio, the distinction matters. Generic satisfaction scores tell you how customers feel. Behavioral questions tell you what they actually did and why, which is often more actionable.
How Did Twilio Bridge a Critical Customer Data Gap With Better Survey Questions?
Here is a real example of what happens when a company shifts from generic satisfaction tracking to behavioral, in-context questions.
The Situation: After Twilio acquired SendGrid, the combined team realized they were missing behavioral data on specific customer segments.
They needed to understand how customers were actually using the product, what their intentions were when visiting certain pages, and whether they were accessing the product on mobile.
This was not a sentiment problem. It was a knowledge gap that required developer resources to solve through database queries, which they did not have bandwidth for.
What They Changed: Instead of relying on static participant databases and post-session surveys, they deployed in-product nudges that appeared contextually at the right moment on the right page.
The questions were behavioral, not evaluative. “How are you using this feature?” instead of “How satisfied are you with this feature?”
What They Found: They could now reach customer segments outside their existing database, gather real-time behavioral data without engineering support, and share segmented results directly with stakeholders in a format that was immediately actionable.

“Qualaroo pops up on different sites wherever we decide to put it up, which enables us to recruit customers outside of our database. The targeting feature is great, along with the ability to type in information about customers and target them with surveys.”
— Nthabi Choma, Research Operations Manager, Twilio
The lesson here is not about the tool. It is about question design. Twilio was not asking better satisfaction questions. They were asking fundamentally different ones: behavioral, contextual, and tied to a specific moment in the product experience. That is what produced useful data.
If you are running satisfaction surveys and the results feel vague or hard to act on, it is worth asking whether you are measuring satisfaction at all or just asking customers to confirm what you already think.
FREE. All Features. FOREVER!
Try our Forever FREE account with all premium features!
Start Asking Questions That Actually Help You Act
Bad survey questions are not neutral. They produce data that looks confident, leading to the wrong decisions.
The fix is not more questions. It is better ones, asked at the right moment, with a clear plan for what to do when responses come in.
Pick the touchpoint where you most need clarity right now: post-support, post-purchase, or in-product. Start with one of Qualaroo‘s ready-to-use CSAT templates, customize the questions using the frameworks in this guide, and collect your first responses in minutes.
Frequently Asked Questions
How do CSAT, NPS, and CES questions differ?
CSAT measures satisfaction after one specific interaction. NPS measures how likely a customer is to recommend you, making it a long-term loyalty signal. CES measures how easy it was to get something done, which is one of the strongest predictors of churn in service-heavy businesses. Each requires different question phrasing, a different scale, and different timing to be useful.
What open-ended questions uncover customer sentiment?
Use one open-ended question per survey, placed last, and triggered only for low scores or exit scenarios. Strong formats include: "What almost stopped you from completing this?" and "What would make this experience a 10 for you?" Keep the prompt short and the response field open. Do not offer suggested answers.
How do you measure customer satisfaction accurately?
To measure customer satisfaction, use a consistent scale, trigger surveys at defined moments rather than on a fixed schedule, and track scores over time against an industry benchmark. A single CSAT reading tells you very little. The trend over three to six months, combined with open-text qualitative data, is where the real insight lives.
What questions identify sources of customer dissatisfaction?
Follow a low CSAT or NPS score with: "What was the main reason for your score?" Keep it open-ended. Closed-ended follow-ups introduce bias and limit the insight you can extract. The customer's own language will tell you more than any answer option you could design.
How often should businesses run customer satisfaction surveys?
Trigger surveys at key moments, post-support, post-purchase, post-onboarding milestone, post-feature use, rather than on a fixed calendar schedule. Event-driven timing captures experience, not memory. A passive, always-on feedback widget covers customers who want to share feedback between those defined moments.
How do CSAT survey results improve customer experience?
They create a feedback loop: a score drop signals where to investigate, open-text responses reveal the root cause, and re-measurement after a fix confirms whether the change worked. Without closing the loop, scores are just numbers that get presented in meetings and forgotten.
What scale should you use for customer satisfaction ratings?
Use 1–5 for general CSAT on mobile or quick post-interaction surveys. Use 1–7 for CES or more nuanced experience feedback. Reserve 0 to 10 for NPS only, where the Promoter and Detractor math requires that range. For the fastest possible response, a binary thumbs-up or down works well on mobile but gives you no diagnostic depth.
FREE. All Features. FOREVER!
Try our Forever FREE account with all premium features!
 We'd love your feedback!
What did you like & how can we make it even better?
 Thanks for your feedback!
 Ask Your Question
Have a question? Get expert help to make your decision easier.