User behavior is key to understanding how your users interact with your brand and products.
And once you analyze that interaction, you’ll be able to discover any pain points that exist and improve customer experience.
But how do you analyze user behavior in the first place?
Let’s say you have a brick-and-mortar store where you can keep an eye on the customers to see how they move and if they look confused while navigating through the aisles.
But that isn’t the case for online users.
When we talk about eCommerce websites, the visibility you get for each customer is limited, and you would probably have a hard time understanding how they behave.
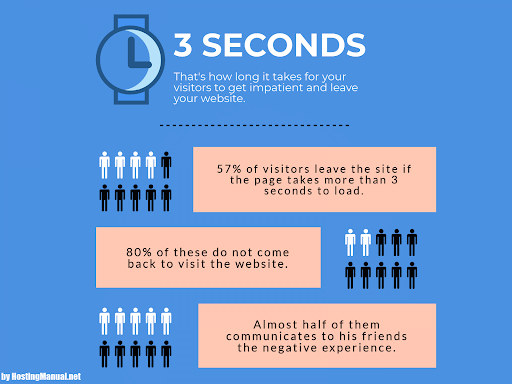
And if you’re not analyzing your visitors’ behavior to know this, they’ll not return.
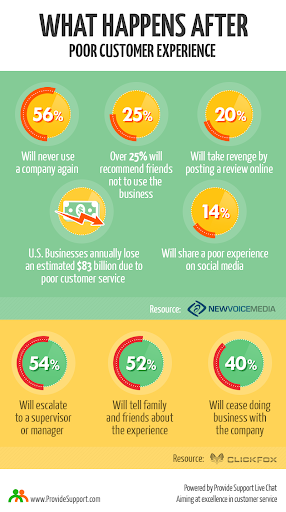
In fact, 56% of the customers will never deal with a company again if they have a poor customer experience.
So you cannot ignore it.
In this blog, we will help you analyze your visitors’ behavior to improve customer experience. We’ll also take you through concepts like visitor behavior analysis which you don’t want to miss.
Stick around.
What Is User Behavior?
User behavior describes how users interact with your product or brand, for instance, on your platform, mobile application, or website.
Needless to say, user behavior includes every action that users can possibly take on your website. These actions include:
- Where do they click on the page
- What is their scrolling behavior
- What do they look at
- Where they drop off the page
Tracking user behavior data will uncover the level of user engagement and help you find your website’s strong and weak points. You can then work on improving the customer journey to increase engagement, retention, conversion, revenue, and other metrics that matter for your business development.
What Is User Behavior Analysis (UBA)?
User behavior analysis (UBA) is the process of gathering and analyzing data about how your users behave while interacting with your website or mobile app.
Analyzing user behavior can help you uncover the root cause behind the changes in your user’s behavior that may impact engagement, retention, churn, and conversions. With analytics in your hand, you can make data-driven decisions to improve those metrics instead of relying on guesswork.
Traditional analytics can give you all the numbers you need, including:
- Number of visitors coming to your website
- Number of visitors leaving
- Places they come from
- Number of conversions, etc.
However, traditional analytics fails to answer the ‘Why’ behind all those metrics.
User behavior analysis (UBA) is equipped with tools that can help you see the big picture of user behavior.
To be precise about what UBA actually is: it’s not one tool or metric, but a practice that combines behavioral analytics (what users do), attitudinal feedback (what users say), and conversion data (what users complete) to answer questions raw analytics can’t.
Keep these three categories distinct as you read through the rest of this guide, since conflating them, treating a heatmap finding as equivalent to a survey response, for instance, is a common way teams draw the wrong conclusion from otherwise good data.
Note: Do not confuse UBA with UEBA, as the former stands for user behavior analysis, and the latter stands for user and entity behavior, both of which are quite different.
Top 3 Ways to Analyze User Behavior on Your Website
There are plenty of ways of analyzing user behavior on your website. These include:
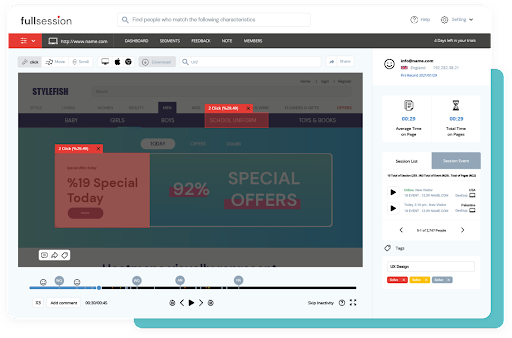
- Session Recordings
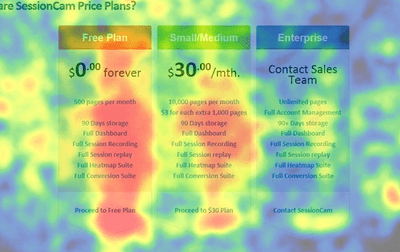
As the name suggests, session recordings are video renderings of the length of the sessions that your website users have. These renderings record actions taken by your website users in real time, including cursor movement, clicks, taps, scrolling, page switching, and much more, to identify how users interact with it.
- Heatmaps
Heatmaps are extremely popular when it comes to identifying how users interact and behave with your website. Heatmaps indicate where your website users spend the most time by highlighting it with heat signals.
Hot signals highlighted with red or orange indicate high interaction areas, whereas cold signals highlighted with blue indicate low interaction areas.
One Caveat Worth Flagging Early: An aggregate heatmap blends every visitor together, which can mask real differences between segments. A heatmap combining desktop and mobile traffic, for instance, can show a misleading pattern if the two behave very differently. Where your tool supports it, segment heatmaps by device, traffic source, or visitor type before drawing conclusions from them.
On-site surveys are a great way to identify user behavior by directly asking users how they feel about their interaction with the website. You can deploy on-site survey widgets on specific pages to collect targeted feedback in an unobtrusive way to boost user experience.
Using various metrics like session recording, heatmaps, and surveys is great for collecting data but might not always tell you why or how some things happen in terms of user behavior. That’s only possible when you back your data with context and do great behavior analysis.
Now that we know what analyzing user behavior is let’s enlighten ourselves on why it’s so important for businesses.
Importance of Analyzing User Behavior
The most important reason why analyzing your visitors’ behavior is important is because it will tell you ‘Why’ users behave in the way they do. Behavioral metrics go only as far as ‘What’ users do on your website or ‘How’ they do it. Behavior analysis of visitors answers all your ‘whys.’
Let’s look at some important reasons for analyzing users’ behavior.
- Understanding User’s Needs
Behavior analysis of visitors can critically analyze what your visitors do and provide you with visitor insights on what they want, need, and appreciate. Having an in-depth knowledge of your user’s needs and wants will help you design user-centric products and customer-centric organizations.
Even if you did an in-depth analysis before launching your product, you shouldn’t stop there.
User behavior is an ever-changing phenomenon.
To always stay up to speed with users’ preferences, expectations, and market trends, conduct a behavior analysis of visitors regularly so that you don’t miss out on the important bits.
Website surveys are a great way of doing that. You can use an online survey tool like Qualaroo to build surveys and collect data about users’ preferences and expectations every quarter with the help of 12+ built-in question types.
You can also use advanced targeting modes to only survey users that matter to your business and build a solid foundation for refining and improving your products later in their life cycle.
Sign up for Qualaroo and start collecting feedback instantly.
- Analyze Your Performance
Every action users take on your website indicates how your website performs, and the same goes for the lack of actions taken by users.
For instance: If you monitor visitors on the website and see low click-through rates from your CTAs even though your traffic is high, it’s worth considering going back to the drawing board and working on the visibility and clarity of your CTA.
Observing similar situations with different elements will highlight how those elements are performing and the areas of improvement you’ll have to work on.
You can also consider pairing all the different elements of your website that users interact with to identify the overall performance before and after making changes.
Also, once you notice substantial changes in your Key Performance Indicators (KPI), behavioral data can help you narrow down likely contributing factors, though isolating the exact cause usually requires ruling out other variables (seasonality, a concurrent marketing push, a site-wide change) rather than assuming the first correlation you spot is the explanation.
- Spot Areas of Struggle
Learning about a bug in your website through user complaints is bad.
Learning about it through a social media post is worse!
Suppose problems in your website continue to persist. In that case, your user experience will take a blow resulting in your users leaving for good and negatively impacting your organization’s reputation in the long term.
Behavior analysis of visitors in real-time will let you spot any problems with your website as they occur a
- Raise MRR and Conversion Rate
According to McKinsey, organizations that leverage customer behavior insights report significantly stronger sales growth and gross margins than their peers.
Worth reading this as a correlation between mature behavioral analytics practices and business performance, rather than a guarantee that adopting the tools alone produces the results, execution, and follow-through on what the data shows still matter.
For you, a good place to start will be with the conversion rate. By analyzing the user behavior, you can identify places where your users face trouble converting and bounce off from your website. These places can be:
- Improper CTA
- Lack of information
- Too much information
- Irrelevant visuals
- Unclear navigation
Once you identify the exact places that need improvement, you can work on improving your conversion process. This will help you increase your conversion rate significantly from the same amount of traffic.
With the importance of visitor behavior analysis out of the way, let’s now move on and look at some important metrics for user behavior that you can track.
FREE. All Features. FOREVER!
Try our Forever FREE account with all premium features!
How to Track User Behavior on a Website with Important Metrics
Developers and marketers work increasingly hard to create attractive websites and optimize them to try and get people to visit them.
However, these efforts often go in vain in the real world because the creators fail to factor in problems that users face during their visits. You can easily overcome this challenge; simply monitor website visitors using the most detrimental metrics to know what works and what doesn’t.
Here are some of the metrics for your visitor tracking:
- User Experience Signals
User experience isn’t a single metric; it’s a broad outcome area made up of several distinct signal types working together: behavioral analytics (what users do, like clicks and scroll depth), attitudinal feedback (what users say, through surveys), and conversion analytics (what users complete). Analyzing the gap between the experience you intend to deliver and the one users actually have means looking across all three, not picking one and calling it “UX data.”
The behavioral piece of that picture is what’s covered in this section: in-page clicks, mouse movement, site speed, and session recordings. Pair it with the attitudinal feedback covered elsewhere in this guide to get the fuller picture.
Measuring user behavior can be a little tricky and requires collaborating with different teams most of the time. Collaborating with designers, marketers, and developers is best because everyone plays a vital role in monitoring different aspects of user experience.
Speaking of aspects, here are some of the different types of behavior you can track:
- In-page clicks
- Mouse movement
- Site speed
- Live visitors
- Recording
But that’s not all; you need to gather the data as well.
Tools to use
There are plenty of tools you can use to gather user experience data. For instance: You can use Crazy Egg and Lucky Orange to track website visitor behavior and see how they move through your website by recording user sessions.
You can also deploy Qualaroo to simply ask how your visitors feel about your website by conducting on-site surveys and gauging user behavior.

When you have all the data that you need relating to user experience on your website, you can make changes to your website that will:
- Help retain more visitors
- Engage them for longer periods of time
- Get more conversions
Related Read– How to Conduct User Experience Surveys: Templates & Best Practices
- Content Performance
Content is your marketing fuel, so always ensure that you have enough of it.
It’s also the very reason why people come to your website.
But that’s not all either. Content is what your users interact with.
The kind of content you create will impact the level of interaction and engagement your users have with your website, resulting in proportionate conversions.
Here are some of the content performance-related metrics you can track:
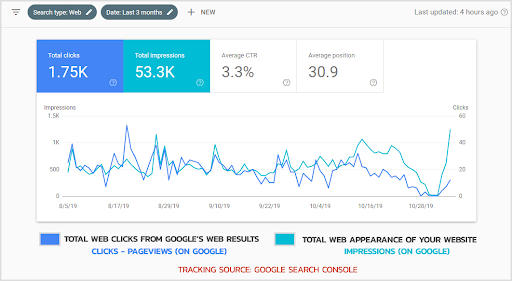
- Impressions
- Visits
- Clicks
- Shares
- Bounce and exits
You can use Google Analytics to gather this data to see where your content stands. The good thing about Google Analytics is that it’s a freemium service, very detailed, and has tons of filtering options that can help you extract the exact data you want on any page.
When you’ve got all the data available about the performance of your content. You can tweak your content strategy based on multiple observations like:
- Type of content your users most engage with
- The medium through which your users get their content
- Their actions during the engagement
Once you have this content performance data, you can pair it with the previously collected user experience data to decide on a content strategy.
Your users define conversion. Converting your users is always the end goal of every organization.
From an eCommerce transaction to a lead generation form, every successful interaction counts as a conversion and contributes towards measuring the performance and goal.
Your aim is to optimize the number of conversions for a number of visits to ensure that the website is performing how you intend it to perform.
Here, you’ll need to optimize the path leading up to the conversion.
For that, you’ll need to first measure the steps that directly lead to conversions. The elements that you can track relating to user behavior are:
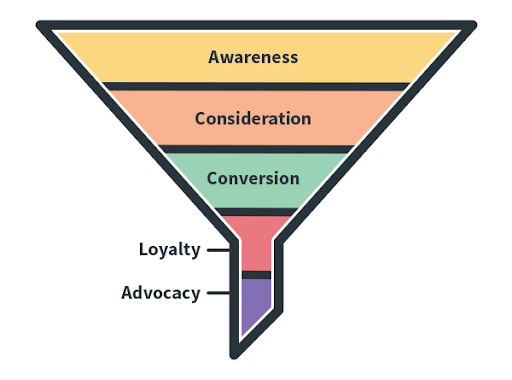
- Conversion funnel
- Checkout process
- Form testing
- Variable testing
Tools to use
There are plenty of great analytics and UX tools out there, like Google Analytics and Lucky Orange, that can help you collect relevant data for optimizing conversions.
And again, you can use an online feedback tool like Qualaroo to ask your visitors directly about what’s preventing them from getting converted. Using contextual feedback, you can easily assess your sales funnel and even conduct A/B testing for different elements of your website, like CTA, on-page content, and more.
Gathering data about your conversion rate will help you to identify the exact elements that tip your users off in your conversion funnel.
With all the data you have, you can supercharge your marketing efforts while optimizing your conversion funnel side-by-side to ensure maximum return on your investments.
Watch: What is Qualaroo? See How Qualaroo Survey Software Works
- User Engagement
Every visitor won’t convert; that’s the harsh reality.
A customer journey requires multiple website visits before a prospect can decide whether or not to transition into the buying mode.
As a website owner, your objective must be to assist and guide our visitors at every stage of their journey by engaging them along the way.
Tools to use
Here, you can track website visitor behavior by interacting with them through:
- Chatbots
- Live Chat
To gather the data from live interactions, you can deploy an online live chat tool that will allow your support teams to get in touch with your users directly. In fact, these tools are also equipped with chatbots that work 24×7 so that your visitors are never left unattended.
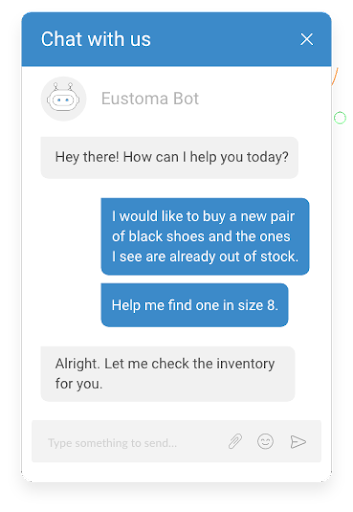
Live chat is a great way to provide extra aid to your visitors and gain contextual visitor insights from them, which on-page analytics can rarely do.
Once you have the data, you can review the analytics and mine for specific data points on:
- Reason for getting assistance
- Frequent issues
- Questions asked
- Satisfaction score
When you analyze the results from your live chat and analytic tools, you’ll uncover some common questions your visitors ask and the problems they face with content, navigation, conversion process, and more.
Collaborate with your support, development, and marketing team to find ways of using this interaction data for development, marketing, optimizations, and more.
You should resolve frequent questions and issues as soon as possible for a delightful user experience.
Related Read– Best Live Chat Software Solutions To Consider In 2026
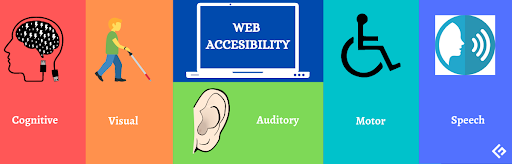
- Accessibility
Accessibility issues show up in your behavior data whether you’re looking for them or not, often disguised as something else. A high drop-off rate on a form might look like a copy or design problem, when the real cause is a form field that isn’t properly labeled for screen readers. A confusing heatmap pattern might reflect users with motor impairments struggling with small tap targets rather than genuine disinterest in that part of the page.
This is why accessibility testing and behavioral analysis work best together, not as separate projects. When you notice an unexplained pattern in your session recordings or heatmaps, checking accessibility is a worthwhile early hypothesis, not just a compliance afterthought.
To track this, combine automated testing and validation (tools like the Lighthouse auditor in Chrome DevTools catch common WCAG violations quickly) with live site tools and, where possible, testing sessions with users who rely on assistive technology. Automated tools catch a meaningful chunk of issues, but they don’t catch everything, like whether a screen reader announces your content in a sensible order.
Given how broad this topic is, and the litigation risk tied to non-compliance, it’s worth treating accessibility as a standing part of your behavior analysis process rather than a one-time audit, and looping in legal and development early if you uncover a significant gap.
With website visitor tracking out of the way, it’s time to move on to the step-by-step framework of analyzing user behavior.
Analyzing User Behavior: A Step-by-Step Framework
At this point, you should know what user behavior metrics to use if you want to track website visitor behavior and the suitable website visitor tracking tools to pair with them.
But that alone is not enough.
You would need a properly constructed framework to implement your visitor behavior analysis and get the data that will impact real business decisions.
We’ve constructed three distinct steps for this framework that are easy to implement:
Step 1: Identify Visitor’s Intent
Want to know why users come to your website? Uncover the drivers that motivate your visitors to land there.
There are primarily three different types of website visitors you can consider:
- Browsers- Those visitors who have no purpose of making a purchase and are there just to look around.
- Returning visitors- Those who keep coming to your website and do consider making a purchase but might need a little more push to make that decision.
- Decided buyers- Those who have chosen your brand and have all the intentions of making a purchase.
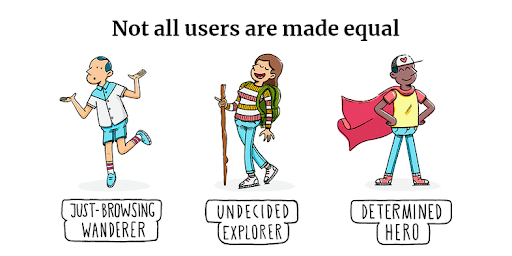
The browsers are hard to convert because they might not even need your product and are visiting your website because of unrelated reasons. The decided buyers have already made up their minds, so you need not put in an effort to woo them.
The return visitors are the ones who you need to understand deeply and get converted.
To do that, you would need an online user feedback tool like Qualaroo, which you can pair with an on-site analytics tool like Google Analytics to back up your efforts.
You can start with running the analytics to identify which channels bring the most audience and then deploy relevant strategies to keep the traffic coming.
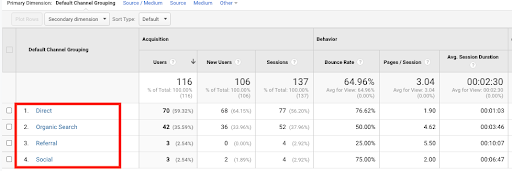
For instance: If your social media channels like Facebook bring the most traffic to your website, improve and supercharge your social media campaigns to invite more return buyers.
Or
If most of your users arrive due to organic searches, expand your search engine optimization efforts to improve the visibility of your website.
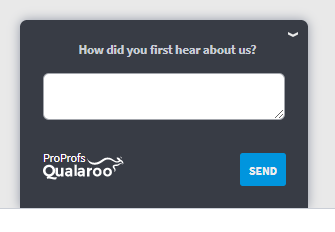
Once you’ve identified your most valuable resources, it’s time to place a survey on your home page to identify the intent behind your users’ visits. You can ask questions like:
- How did you find out about us?
- What motivated you to visit our website?
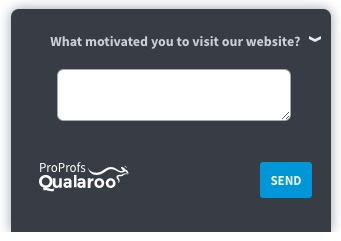
- What are you looking for today?
- What search term did you use to find us?
- What did you hope to find on this page?
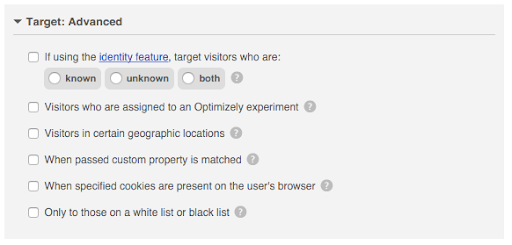
Also, to gather data only from the users who are relevant to you, you can use advanced targeting modes to make your survey only appear to people who qualify for your feedback requirements.
Once you have all the data you need from your visitors, it’s time to create buyer personas to build an accurate representation of your customer base. Your buyer personas should ideally answer the following questions:
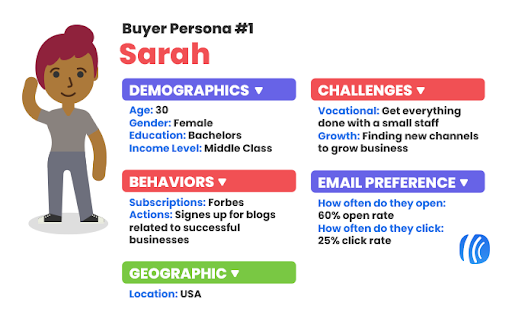
- Who are your customers?
- What are their primary pain points?
- What barriers do they face in solving their pain points?
The data you gather from your surveys will enable you to build accurate buyer personas and help you in profiling your customers.
Optimize with perfection using contextual feedback. Get started now!
Related Read– User Research: A Practical Guide for Beginners
Step 2: Identify Exit Intent
When building your buyer personas, you would have come across the ‘barrier‘ section.
Yes, these are the same barriers that prevent your users from getting converted, and they end up bouncing.
Even the smallest elements (like the way product pricing is mentioned or the placement of CTA) can act as barriers resulting in your visitors leaving. Identifying user behavior can help answer this question and enable you to fix existing problems with your website.
Investigating the problems with Heatmaps and session recordings
Trying to understand user behavior is great, but doing the same on every single landing page- not so much.
This is where Google Analytics can shine once again.
Using analytics, you can identify the most problematic pages by looking at the bounce rate of each page.
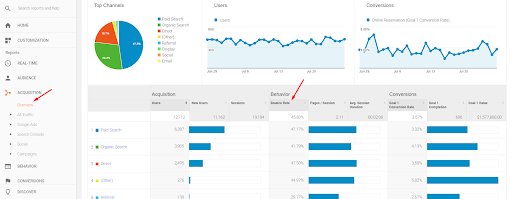
Pages with a high bounce rate are worth investigating, but a high bounce rate doesn’t automatically mean the page is failing. Some pages, like a contact page or a single blog post someone found through search, are expected to have high bounce rates simply because visitors got what they needed and left. Segment bounce rate by page type and traffic source before treating it as a problem.
Once you’ve identified pages with a concerning bounce rate, use session recordings to see how users actually interacted with the page before leaving.
Rather than watching recordings at random, sample deliberately across a few dimensions:
- Device type (desktop behavior often looks nothing like mobile),
- Traffic source (an ad-driven visitor may behave differently than an organic search visitor),
- Journey stage (first-time visitor versus returning)
- Specific drop-off point on the page.
Watching 10 to 15 recordings spread across these categories will usually surface more reliable patterns than watching 50 recordings from the same segment.
As you watch, log what you see in a structured way rather than general notes: the exit URL, device, and traffic source, the specific action right before the drop-off, and anything else notable.
This turns a pile of anecdotal observations into something you can actually look for repetition in.
On top of screen recordings, you can also use heatmaps to support your observations and gather additional data about the problems faced by your users. Look for specific website elements to gather evidence as to why your website users take certain actions.
We’ve already talked about session recordings and heatmaps in the above section, so feel free to refer to that to refresh your memory.
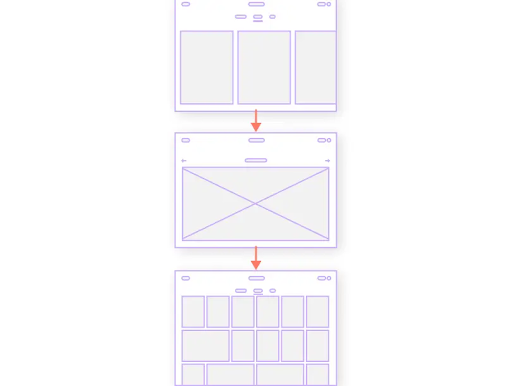
To give you an example: Here’s a heat map of a website that highlights the areas with the most and the least interaction by the users. On the left, you can see that users interacted the most with the top part of the website, and on the right is quite the opposite.

From this, you can deduce that most users absorb only the information given at the top of the website, and the interaction starts to decline as the website progresses (indicated by a cold blue trail). Therefore, you should move any important information on top of the website for it to be noticeable to most visitors.
But just the data is never enough. You would need context as well to make sense of the data.
For that, you need to deploy exit-intent surveys on your website and ask users about specific reasons why they are leaving your website. You can post these surveys on pages with the maximum bounce rate, and they’ll automatically trigger when a user is about to leave.
Also, keep it open-ended; keep it simple.
Here are some questions that you can ask:
- Is there anything missing from our website?
- What is preventing you from signing up?
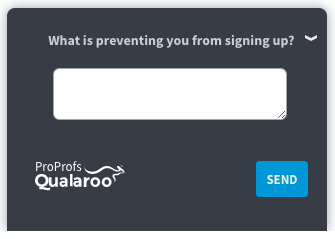
Get This Exit Intent Survey Template
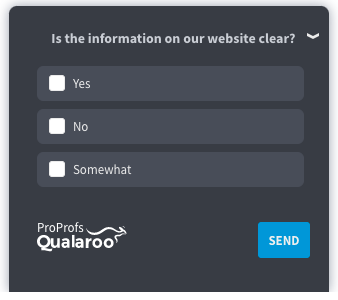
- Is there anything we can do to make our website clear?
- What, according to you, should work better on this page?
- Is the information on our website clear?
- What is preventing you from starting a trial?
- What made you cancel your subscription?
Related Read– What Survey Questions Should I Ask?
Step 3: Uncover Reasons Behind Conversion
When analyzing user behavior, one of the most overlooked factors is why users convert and what happens when they do. Usually, getting conversions is the end goal for most sales teams, so they fail to consider the positives and use those elsewhere.
Knowing the exact reasons why users convert will help you:
- Identify your strongest selling points so you can emphasize them even more
- Uncover the most engaging parts of your website so you can leverage them to optimize your conversion funnel accordingly
- Create an ideal customer profile to position yourself better in the market
Suppose you want to identify what persuaded your users to convert. In that case, you need to identify patterns to see what your users have in common when it comes to visiting your website, overcoming barriers, and getting converted.
Make user feedback a regular deal.
As we discussed above, user feedback is arguably the most effective way to discover more about your customers. There are different ways you can learn about your customers, including:
- Post-purchase surveys- A post-purchase survey is a great way for product owners to know why their customers made a purchase. Simply post a popup survey on your thank you page asking what motivated them to buy your product. Instant surveys like these can easily identify dominant areas in your conversion funnel and help you optimize it even further for better results.
Collect insights that are 10x more powerful than emails. Sign up for a free trial.

- Email surveys- Email surveys are a popular way of asking customers about their experience and intent after a short span of time once they have made a purchase. Our research at Qualaroo suggests that it’s best to analyze your results after a week of sending your email surveys, as you would have received most of your responses by then.
Here are some email survey questions that you can ask:
- How would you like to rate your overall purchase experience?
- Please rate the overall level of satisfaction with the product.
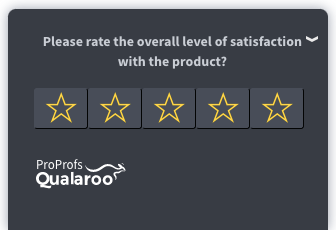
- What was the main reason behind purchasing this product?
- What was the most attractive part about this product?
- What problems are you trying to solve with this product?
- What did you consider before purchasing this product?

- Customer interviews- Another great way of knowing what made your customers convert is by simply talking to them. Ask your customers if you can have a quick call with them to gather feedback about their recent purchases.
Once you’ve interviewed a significant number of customers, you can identify some common reasons that made your customers convert. And just like before, emphasize those reasons in your sales pitch.
When you have all the behavior data about your users, including the positives and the negatives, you can work on conversion rate optimization to maximize conversions and return on investment (ROI).
With that, you have been enlightened about the framework for analyzing user behavior on your website. Now, let’s look at the benefits of doing so.
Watch: How to Create a Popup Survey
Before You Trust the Data: Instrumentation, Funnels, and Hypotheses
The three-step framework above works only if what’s feeding it is solid. A few checks are worth running before you act on any pattern:
Instrumentation quality. Before drawing conclusions from click or scroll data, confirm your tracking is actually firing correctly on every page you’re analyzing. A “low engagement” page is sometimes just a page where the tracking snippet broke after a redesign. Spot-check your event tracking periodically, not just when you first set it up.
Funnel analysis. Individual page metrics only tell you part of the story. Map the full sequence a visitor moves through toward conversion, and look at where the steepest drop-offs happen between steps, not just which single page has the highest bounce rate. A page with a mediocre bounce rate that sits right before checkout deserves more attention than a page with a worse bounce rate that’s near a natural exit point in the journey.
Hypothesis testing. A pattern in your behavioral data is a hypothesis, not a conclusion. If session recordings suggest a confusing CTA is causing drop-off, test the fix with an A/B test rather than rolling it out to everyone based on the recordings alone. This is what separates behavior analysis that actually improves conversion from behavior analysis that just generates plausible-sounding stories.
Segmentation before generalization. A pattern that holds for mobile users may not hold for desktop users, and a pattern among first-time visitors may not hold among returners. Before treating any finding as broadly true, check whether it holds up within the specific segment you’re planning to act on.
Handling Behavioral Data Responsibly
Nearly everything in this guide, session recordings, heatmaps, live chat transcripts, and targeted surveys involves collecting data about identifiable people. That comes with real obligations.
Disclose what you’re tracking in your privacy policy, and get consent where regulations like GDPR or CCPA require it, particularly for session recording and any tracking tied to an identified user.
Mask sensitive fields, payment details, passwords, and personal identifiers typed into forms before a session recording is stored, since a raw recording can otherwise capture far more than you intended to collect.
Set a retention policy for how long recordings and behavioral data stick around, and limit access to people who actually need it for analysis.
If you’re linking behavioral data to identity, through a live chat transcript tied to an email, or survey responses tied to a customer ID, make sure that link is covered by the same consent and retention rules as everything else.
None of this needs to slow your analysis down much. It does mean treating a session recording as more than just a UX artifact; it’s a record of a real person’s activity, and worth handling with the same care you’d want shown with yours.
FREE. All Features. FOREVER!
Try our Forever FREE account with all premium features!
5 Benefits of Analyzing User Behavior on Your Website
Analyzing user behavior is great for gathering first-hand information from users to see how specific pages and elements perform on your website. Let’s look at some more benefits of UBA in a little more detail:
1. Learn Your Audience
Understanding user behavior helps you track consumer behavior online and their needs all at once.
This is because UBA deploys plenty of data and feedback collection techniques, which we discussed earlier, to identify who the customers are and what products and services you can offer them to satisfy their needs.
GraphicSprings Case Study
The Problem
GraphicSprings had a painfully slow end-to-end process of surveying users and interpreting the feedback data. They embarked on a mission to better understand their users to increase their revenue and improve website conversion.
GraphicSprings’ search for simple, quicker, and targeted feedback led them to Qualaroo and helped them supercharge their growth initiatives.
The Solution
The ease of implementation and low learning curve of Qualaroo made GraphicSprings’ A/B tests agile and impactful.
With the new Qualaroo-led feedback strategy in place, GraphicSprings made changes based on the following:
- Exit Intent
The company uncovered reasons as to why their users were leaving by deploying exit-intent surveys and gathering emails of the abandoning users, and re-targeting them with email campaigns. This reduced shopping cart abandonment by 4% in just one week.
- User Experience
By deploying user experience surveys, the company was able to simplify its editing function by eliminating excess steps. This process simplification resulted in more time spent on the site by 43 seconds and also improved revenue by 10%.
- User Demographic
Survey responses gathered by Qualaroo surprised GraphicSprings, which is why they had to overhaul a lot of their web pages and redesign personas. By redesigning the website and having a better understanding of customer demographics, the company observed an increase in returning visitors by 11%.
The Impact
By better understanding their user base and expectations, the GraphicSprings logo maker tool saw its bounce rate drop by 8%. On top of that, their website’s CTA click-through rate was also up by 7%.
Most importantly, GraphicSprings improved its sales conversion rate from 30% to 50% and its revenue by almost 41%.
Worth noting: these results came from acting on patterns that repeated across multiple data sources, exit surveys, user experience surveys, and demographic data, rather than a single survey response or one session recording. That’s the difference between a well-supported change and a guess dressed up as insight.
Just by knowing who their customers are and what their expectations are from the company.
Purely based on feedback.
2. Make Efficient Improvements
Additionally, the research about trends and interests of your audience will enable you to create and improve the relevant content, high-rated product, and popular services.
When you identify trends and extract customer intelligence from those trends, you can accurately gather visitor insights and make necessary improvements that will impact your business decisions.
User behaviors are ever-changing, and there is no end to that.
This is the reason why gathering speedy visitor insights will make your improvements and optimizations agile and help you create better websites that your users will love.
On a side note: You might not always know what to change or improve because trends sometimes can be a little misleading or may lead you nowhere. So it’s best to ask your customers directly using feedback to know what they’d like to see.
Watch: How to Create a User Research Survey
3. Detect the Weak Points
Visitor behavior analysis shows the exact points your customers always have trouble with or are confused with, such as the procedure of an item’s purchase, the inability to get the full information about a certain product, or the absence of a support team.
UBA provides you with additional knowledge about all of it. Thus, it’s crucial to apply any changes.
A great thing about user behavior is that it helps you detect weak points and problem areas if you closely monitor visitors’ behavior on the website and know what they are saying about your website.
Direct feedback is a major part of UBA, and that gives you an insider perspective of what it’s like to use your website.
All you have to do is analyze the results and try to find emerging patterns or recurring complaints. They’ll guide you in the right direction.
4. Measure the Website Performance
Website performance is no longer a luxury but a necessity.
A good analysis of user behavior will display your website’s overall metrics, pages, and sections and provide basic ideas of how you can improve them.
Also, website performance and user behaviors work greatly in sync.
Designhill, when updating the interface of their logo maker tool, the site encountered significant fluctuations in click-through rate. But soon, they saw an increase in the click-through rate by 5%. They optimized the tool for better performance for their returning and new clients.
For instance: If you add new elements to your website, behavior analysis of visitors will be able to highlight how those new changes are performing.
An increase in bounce rate, drop in click-through rate, and concurrent users will clearly indicate that your website is not performing how you intended it to. Using the website visitor tracking data, you can get back to the drawing board and make changes driven by data.
5. Increase Business Efficiency
If applied thoroughly, you can greatly boost the website performance and the overall efficiency of your business.
The UBA significantly improves the customization process and allows you to reach the target audience without additional expenses for the ads to increase the product or platform awareness.
Start Tracking User Behavior Effectively
Analyzing user behavior equips you with all the right tools you need to not just know about your users but deeply understand why they do something or don’t.
Website visitor tracking is crucial for improving customer experience, and having the right tool at your disposal is just as important as anything else.
Qualaroo is a strong tool for collecting user experience data directly from your website, and its advanced targeting and exit-intent surveys help you focus on the audience that matters most. But the tool only gets you the data.
The value comes from validating patterns across multiple sources, segmenting before generalizing, and testing your hypotheses before rolling out a fix based on a single observation.
FREE. All Features. FOREVER!
Try our Forever FREE account with all premium features!
 We'd love your feedback!
What did you like & how can we make it even better?
 Thanks for your feedback!
 Ask Your Question
Have a question? Get expert help to make your decision easier.