
Your dashboards are full. Pageviews, bounce rates, session duration, funnel drop-offs. You have all of it.
And still, you don’t know why 60% of visitors left the pricing page without converting, or why onboarding completion dropped after the last product update.
That’s the gap customer experience analytics is built to close.
The best customer experience analytics tools don’t just collect more data. They help you connect behavior to intent, at the right moment, in the right context.
That usually means combining behavioral tracking with in-the-moment feedback, then using AI to make sense of what users actually say.
This guide covers the tools worth evaluating, what each one is actually built for, and how to figure out which one addresses your team’s biggest blind spot.
What Are Customer Experience Analytics Tools?
Customer experience analytics tools (CX analytics tools) are platforms that capture behavioral, feedback, and operational data across customer touchpoints and turn it into insights you can act on.
They combine quantitative signals (what users do) with qualitative signals (what they say and feel) to surface patterns that drive decisions.
Most modern CX analytics tools use AI to process unstructured data, such as open-text survey responses, at scale, identify sentiment trends, and surface the root causes behind metrics like NPS, CSAT, and churn rate.
These tools generally cover one or more of three data types. Behavioral tools show how customers move through your site or app.
Feedback tools capture what they explicitly say. Operational tools (support tickets, call transcripts, churn events) add business context.
The strongest CX analytics tools combine at least two of these layers, since each one alone only answers part of the question.
Yet CX teams still use an average of six to seven tools just to manage customer interactions, and most of those tools don’t talk to each other. The insight gap isn’t a lack of tools. It’s a connection problem.
What Are the Best Customer Experience Analytics Tools?
Here’s a quick comparison before the full breakdown:
| Tool | Best For | Free Plan | Paid Starts At | Capterra Rating |
| Qualaroo | In-app and website feedback, NPS, AI sentiment analysis, behavioral targeting | Yes (50 responses) | $19.99/month | 4.7/5 |
| Medallia | Enterprise VoC across all channels | No | Custom | 4.5/5 |
| Qualtrics XM | Enterprise experience management, research | No | Custom | 4.7/5 |
| Mixpanel | Product analytics, funnel analysis, retention | Yes | $28/month | 4.5/5 |
| Hotjar | Heatmaps, session recordings, website feedback | Yes | $39/month | 4.6/5 |
| Fullstory | Digital experience intelligence, rage click, and frustration detection | No | Custom | 4.6/5 |
| Contentsquare | E-commerce and enterprise experience analytics | No | $39/month | 4.8/5 |
| Amplitude | Product analytics, user journey mapping | Yes | $49/month | 4.6/5 |
| Chattermill | Unified feedback analytics, AI theme detection | No | Custom | 4.5/5 |
| Zendesk | Support-driven CX analytics, ticket insights | No | $19/agent/month | 4.4/5 |
Here’s the detailed breakdown of the best customer experience analytics tools:
1. Qualaroo: Best for Capturing Real-Time User Insights In-App & on Your Website Using Contextual, AI-Powered Micro-Surveys
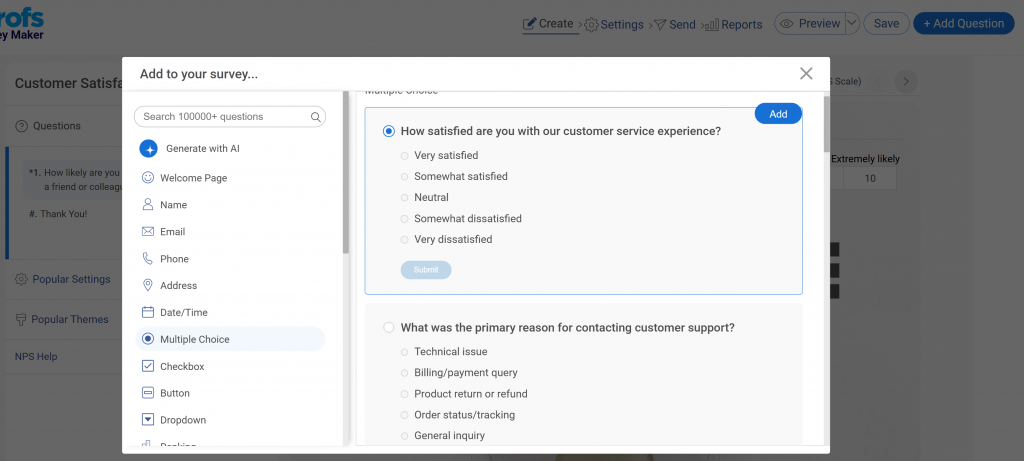
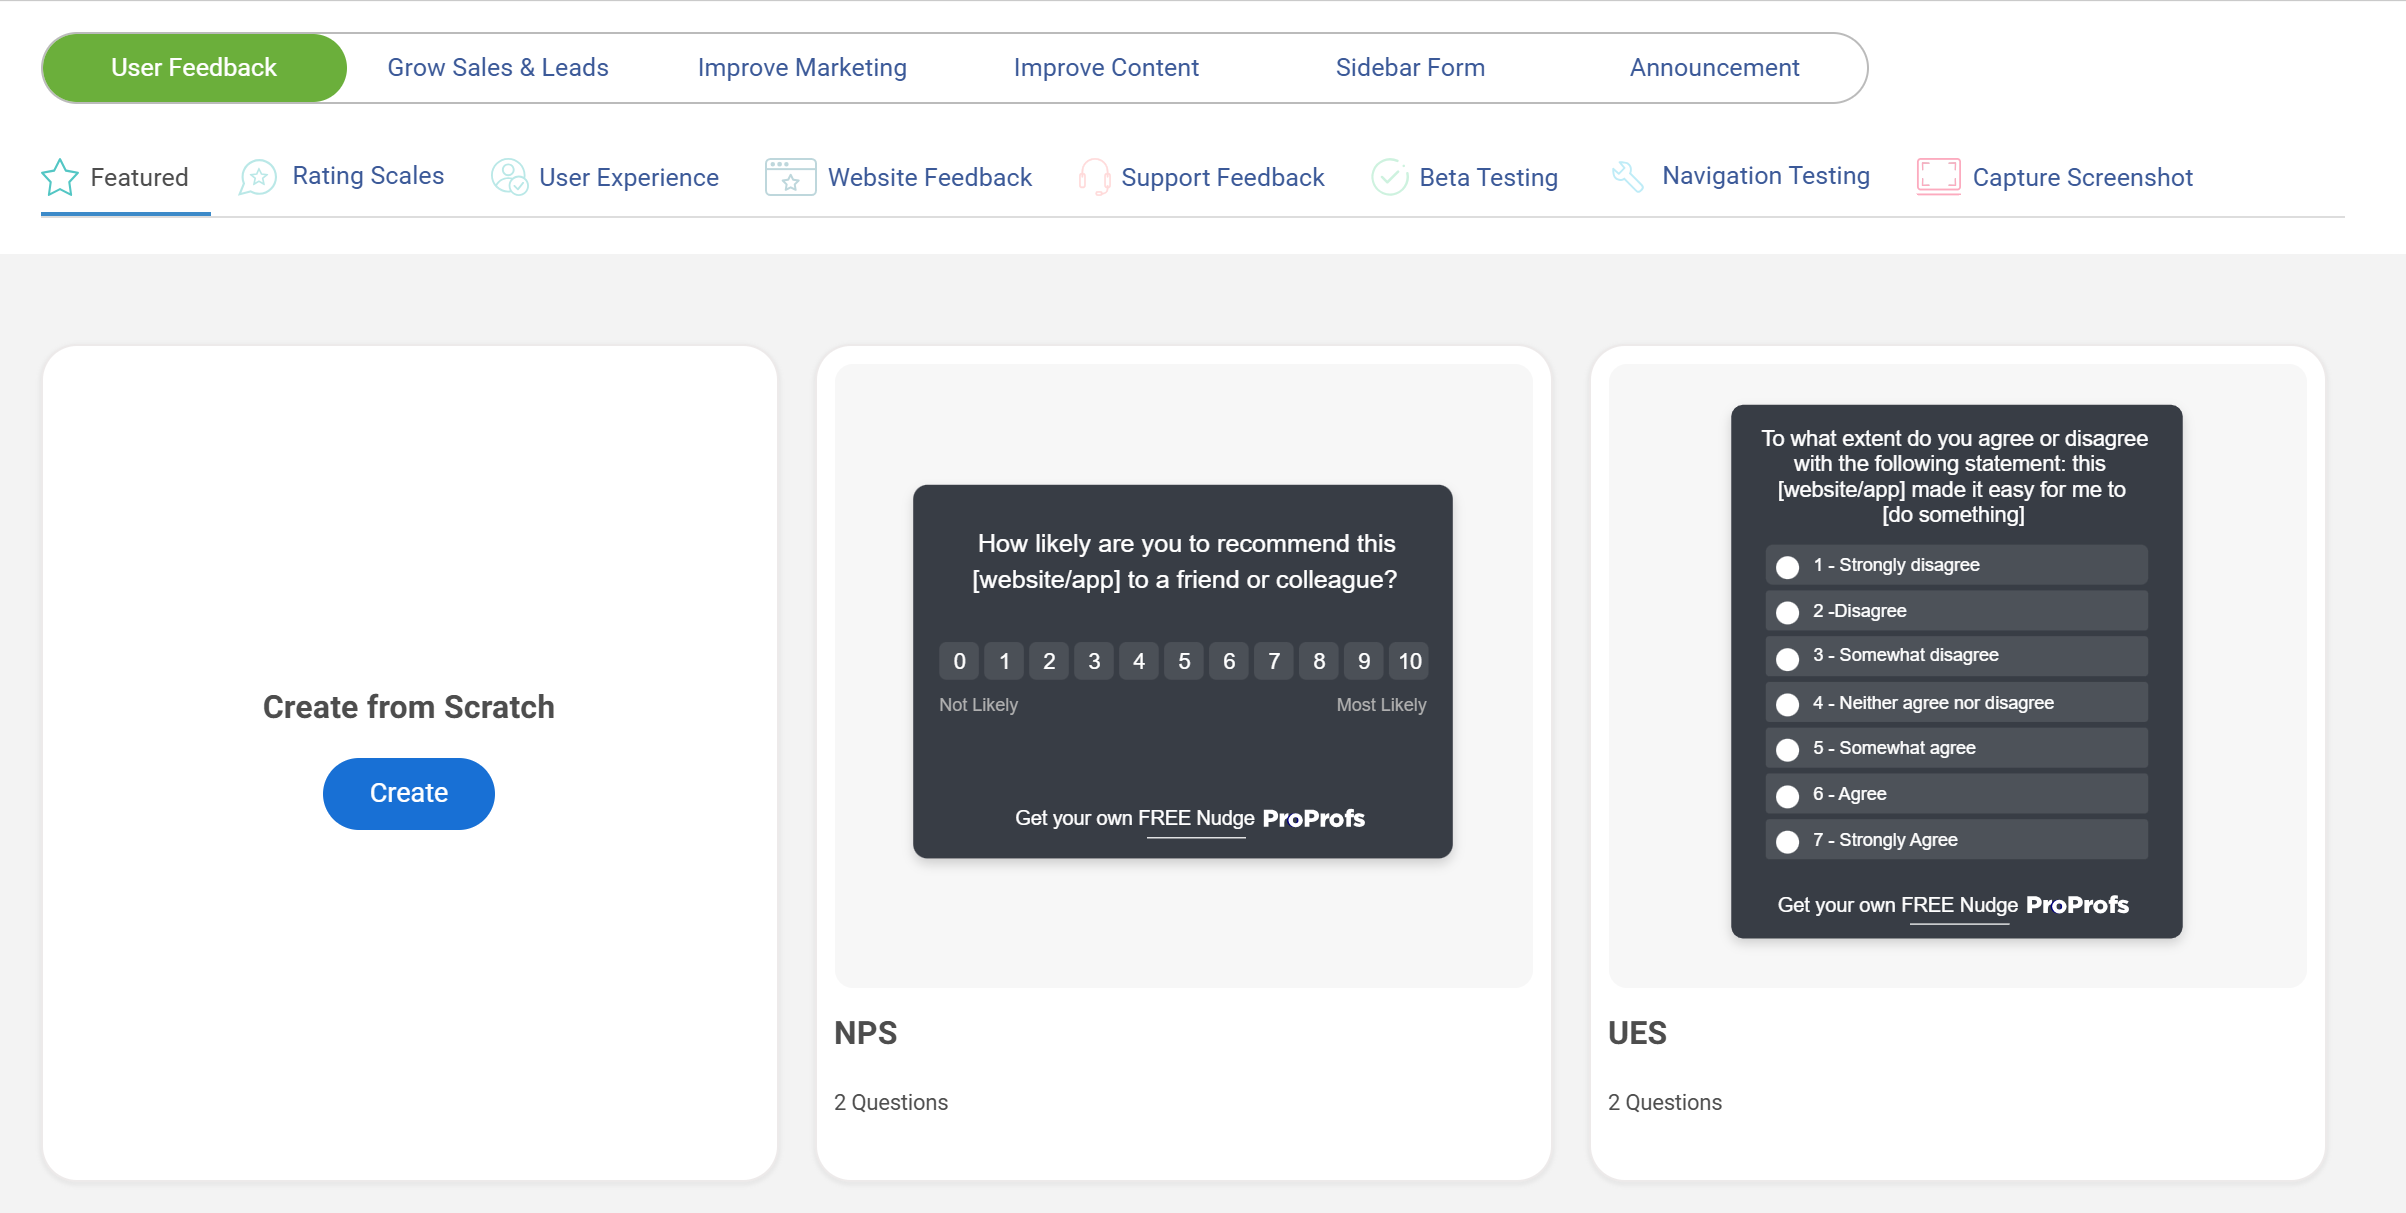
Most CX analytics tools wait for customers to come to them. Qualaroo works the other way around. Its Nudge™ technology deploys non-intrusive micro-surveys directly on your website or app, triggered by behaviors such as exit intent, scroll depth, or user segment, so feedback arrives while the experience is still live.
For open-text response overload, Qualaroo’s native AI Sentiment Analysis automatically groups responses by theme and tone, and the AI Survey Creator can generate a ready-to-launch Nudge™ from a plain-language description of your research goal.
The Identify API ties responses to known users by email or customer ID, and Heatmaps and Session Recordings let you watch the sessions behind a drop-off before you ask why.
Pros:
- Nudge™ surveys triggered by behavioral signals: exit intent, scroll depth, URL, and user segment
- Native AI feedback and sentiment analysis with automatic theme grouping
- AI Survey Creator to generate surveys from a plain-language description
- The Identify API to tie responses to a specific user or customer ID
- Heatmaps and Session Recordings for behavioral context
- iOS and Android SDK for in-app feedback on mobile products
Cons:
- Dedicated onboarding support is reserved for paid plans
- No downloadable or on-premise version
- Custom dashboards are limited compared to standalone analytics platforms
Capterra Rating: 4.7/5
Pricing: Free plan available with all premium features (up to 50 responses). Paid starts at $19.99/month, Business at $49.99/month, Enterprise at $149.99/month.
According to a Qualaroo case study, this in-context approach delivered a 16% lift in conversion for Hootsuite at 98% statistical significance.

2. Medallia: Best for Enterprise-Wide VoC Programs
Medallia is built for large organizations that need to capture and analyze customer feedback across every channel simultaneously, including web, mobile, in-store, call center, and field service, and route those insights to the teams responsible for each touchpoint.
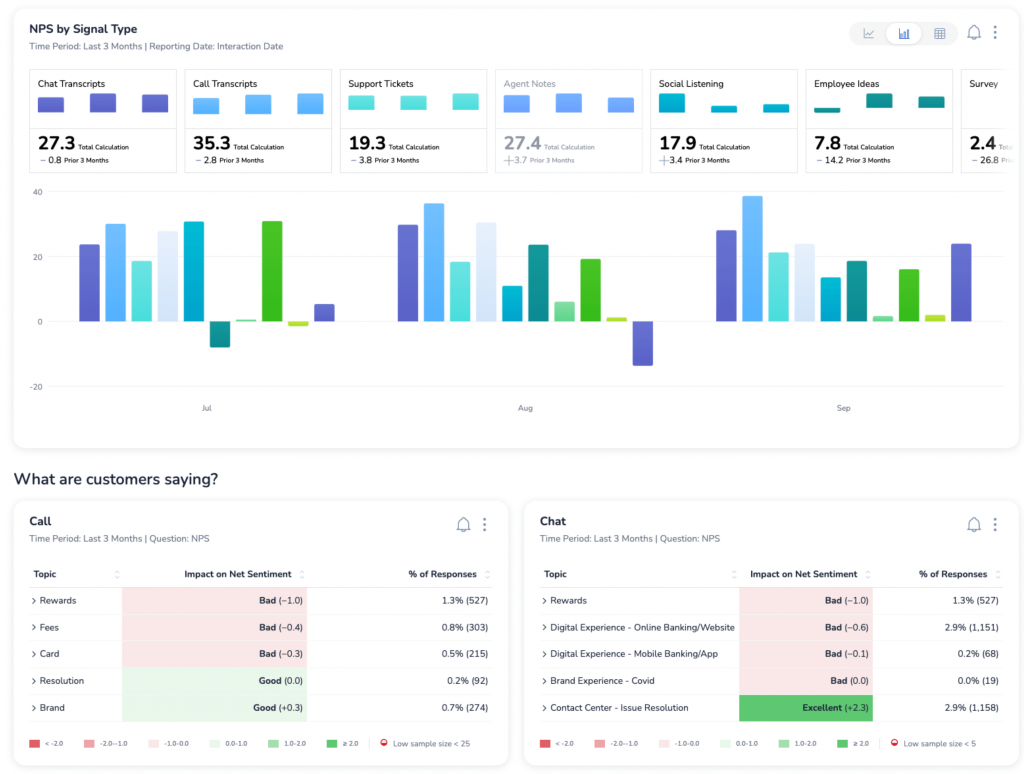
The platform’s strength is breadth. Medallia captures feedback in real time, applies text analytics to unstructured data, and generates continuously updated customer health signals.
The trade-off is complexity and cost. Medallia is an implementation project, not a sign-up-and-deploy tool.
Pros:
- Real-time feedback collection across web, mobile, email, SMS, and in-person channels
- Text analytics and AI-driven sentiment for unstructured data at scale
- Role-based dashboards for closing the loop across business units
Cons:
- No self-serve free plan; implementation requires vendor involvement
- Pricing is custom and typically accessible to mid-market or enterprise only
- Setup and configuration can take weeks before the first insight
Capterra Rating: 4.5/5
Pricing: Custom. Contact Medallia for a quote.
3. Qualtrics XM: Best for Research-Grade CX and Experience Management
Qualtrics XM is the platform of record for large research teams and enterprises that run formal CX programs, including relationship NPS surveys, transactional CSAT tracking, and conjoint analysis.
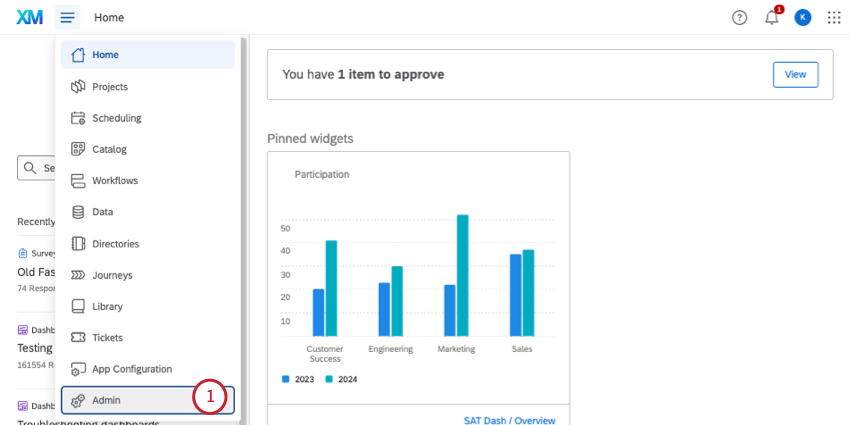
The platform covers four experience pillars: customer, employee, brand, and product, with statistical analysis deeper than most CX tools.
For teams that don’t need research-grade depth and just want to understand why specific users are dropping off a product page, Qualtrics is more than what’s required.
Pros:
- Research-grade survey methodology with statistical analysis built in
- End-to-end VoC programs: relationship NPS, transactional CSAT, churn analysis
- Strong text analytics and AI-powered theme detection
Cons:
- No public self-serve pricing; enterprise contract required
- Configuration and methodology design require dedicated resources
- More suited to formal research programs than ongoing product feedback
Capterra Rating: 4.7/5 Pricing: Custom. Contact Qualtrics for a quote.
4. Mixpanel: Best for Product Analytics and User Journey Analysis
Mixpanel is the go-to for product and growth teams that need to understand how users move through a product, which features drive retention, and where the funnel breaks down.
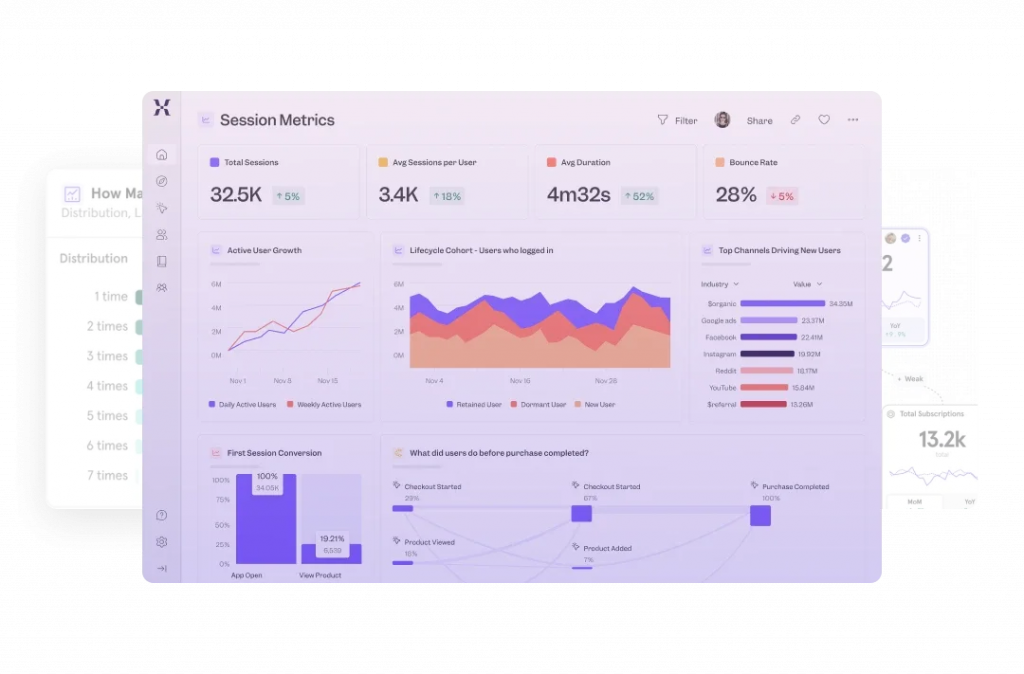
Its event-based tracking model handles funnel, cohort, and retention reporting natively.
Where Mixpanel stops short is the why. It tells you that 40% of users drop off at step three of onboarding, but it doesn’t ask why. Its 2025-2026 update added cart-level analysis and revenue analytics for ecommerce teams.
Pros:
- Event-based tracking with high granularity: funnel, cohort, retention, and flow reports
- Cart-level analysis and revenue analytics for e-commerce
- Free plan up to 20 million monthly events
Cons:
- No native qualitative feedback layer; requires a separate survey or VoC tool
- Implementation requires developer time to define and fire events correctly
- Dashboard can get complex without a dedicated data or product analyst
Capterra Rating: 4.5/5
Pricing: Free (up to 20M events/month). Growth starts at $28/month.
5. Hotjar: Best for Website Heatmaps, Session Recordings, and On-Site Surveys
Hotjar is the most widely used tool in the behavioral analytics category for website teams. Heatmaps, session recordings, and on-site surveys are all available in one platform, with a free plan generous enough for most small to mid-size teams.
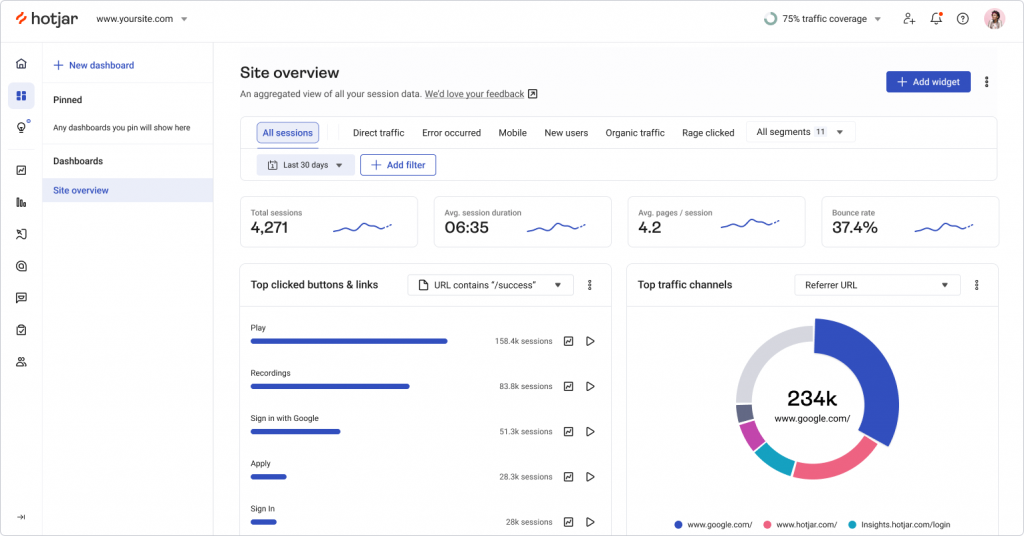
Where Hotjar’s targeting falls short is in granularity. Surveys can be triggered by URL or basic visitor behavior, but the segmentation depth available in more specialized tools is limited.
Pros:
- Heatmaps, session recordings, and on-site surveys in one platform
- Generous free plan with unlimited heatmaps and basic recordings
- Fast setup with no developer dependency for basic tracking
Cons:
- Advanced user targeting and segmentation are limited on lower tiers
- No mobile in-app feedback (web only)
- AI analysis of open-text responses is basic compared to specialized VoC platforms.
Capterra Rating: 4.6/5
Pricing: Free plan available. Business starts at $39/month.
6. Fullstory: Best for Digital Experience Intelligence and Frustration Detection
Fullstory captures every click, scroll, form input, and frustration signal, such as rage clicks and dead clicks, without manual event tagging.
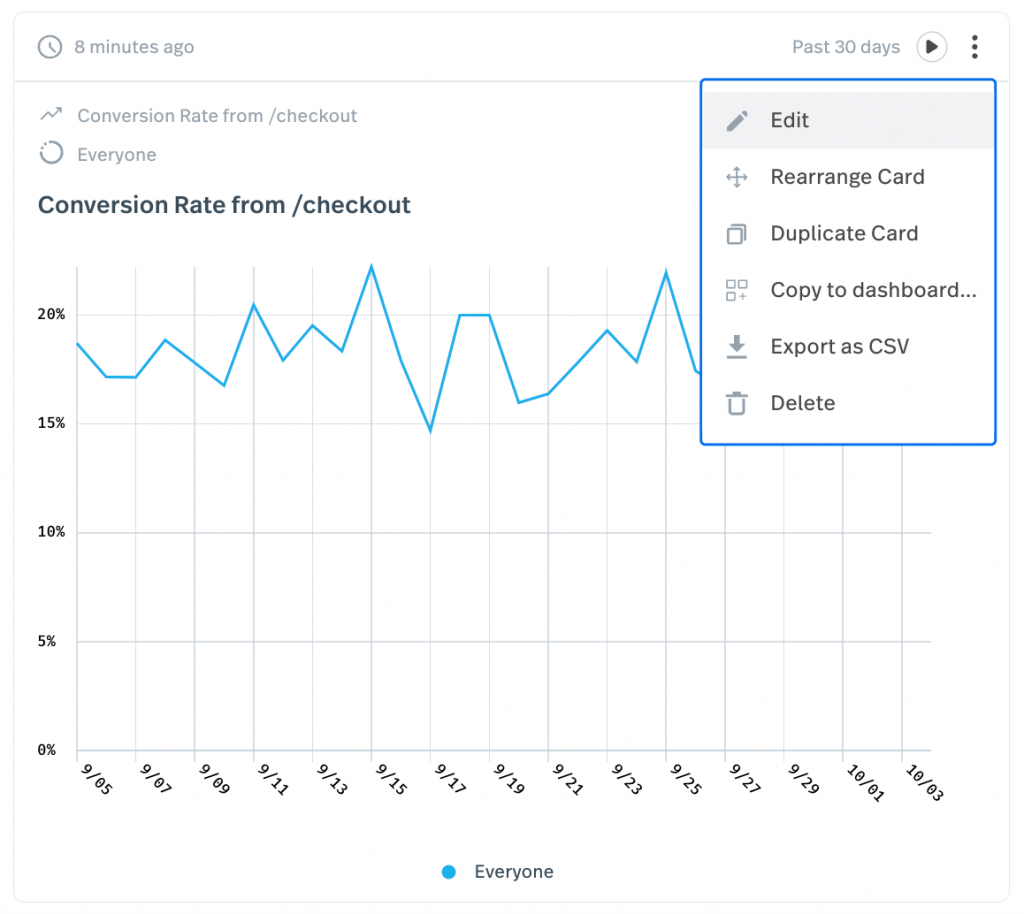
StoryAI, its AI layer, summarizes sessions and surfaces friction patterns across thousands of users without requiring anyone to watch individual recordings.
Fullstory is built for teams with enough traffic volume to make behavioral pattern detection meaningful, with engineering resources to support implementation.
Pros:
- Automatic capture of all user interactions without manual event tagging
- AI-powered session summaries and friction pattern detection at scale
- Rage click, dead click, and error click detection out of the box
Cons:
- No self-serve free plan; pricing is custom and typically enterprise-level
- No native survey or VoC layer; requires a separate tool for direct feedback
- Full value requires a high traffic volume to make pattern detection meaningful
Capterra Rating: 4.6/5
Pricing: Custom. Contact Fullstory for a quote.
7. Contentsquare: Best for E-commerce Experience Analytics
Contentsquare maps user behavior at a zone-by-zone level, showing which page sections drive engagement, which create friction, and which go unnoticed entirely.
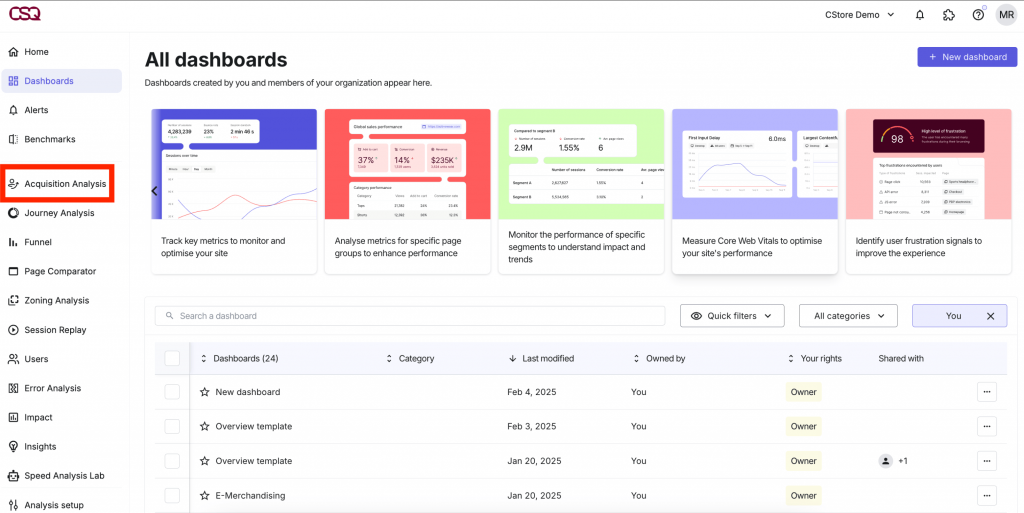
For e-commerce, its product analytics layer connects page-level behavior to cart additions, checkout entries, and conversions.
The friction score feature surfaces pages where user frustration is highest, automatically prioritizing where to investigate first.
Pros:
- Zone-level behavioral analytics tied to conversion and revenue metrics
- Friction score to automatically surface pages with the highest user struggle
- Strong ecommerce-specific reporting: product performance, checkout flow, and cart behavior
Cons:
- No self-serve free plan; enterprise-oriented pricing
- Implementation and instrumentation require technical setup
- Feature depth can be overwhelming for smaller teams or simpler digital products
Capterra Rating: 4.8/5
Pricing: The Growth plan starts at $39/month.
8. Amplitude: Best for User Journey Mapping and Retention Analysis
Amplitude’s path analysis feature lets you see every route users actually take through your product, often revealing unexpected drop-off points and usage patterns.
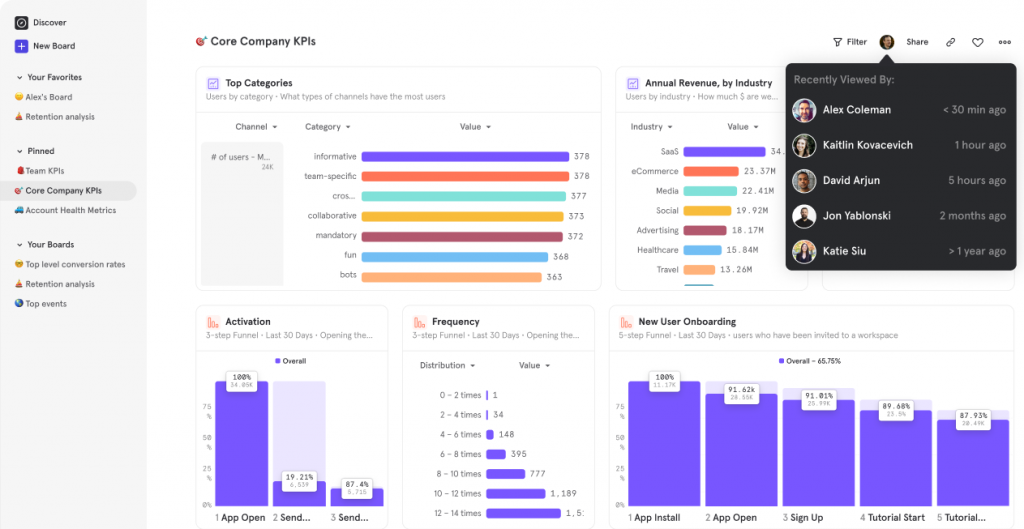
For SaaS products, its cohort-based retention reporting shows how different user segments behave over time and where the experience breaks down for users who eventually churn.
Like Mixpanel, Amplitude tells you what users did, not why. That gap still requires a separate feedback layer.
Pros:
- Path analysis to understand how users actually navigate
- Cohort-based retention analysis with feature-level granularity
- Free plan available with core analytics features
Cons:
- No native feedback or survey capability; requires integration with a VoC tool
- Pricing increases significantly as the monthly tracked users scale
- Best value requires dedicated product analytics expertise
Capterra Rating: 4.6/5
Pricing: Starter free plan available. Plus plan starts from $49/month.
9. Chattermill: Best for Unified Feedback Analytics and AI Theme Detection
Chattermill is built for CX teams that collect feedback from many sources, such as surveys, app store reviews, support tickets, and chat transcripts, and need a single platform to unify and analyze it.
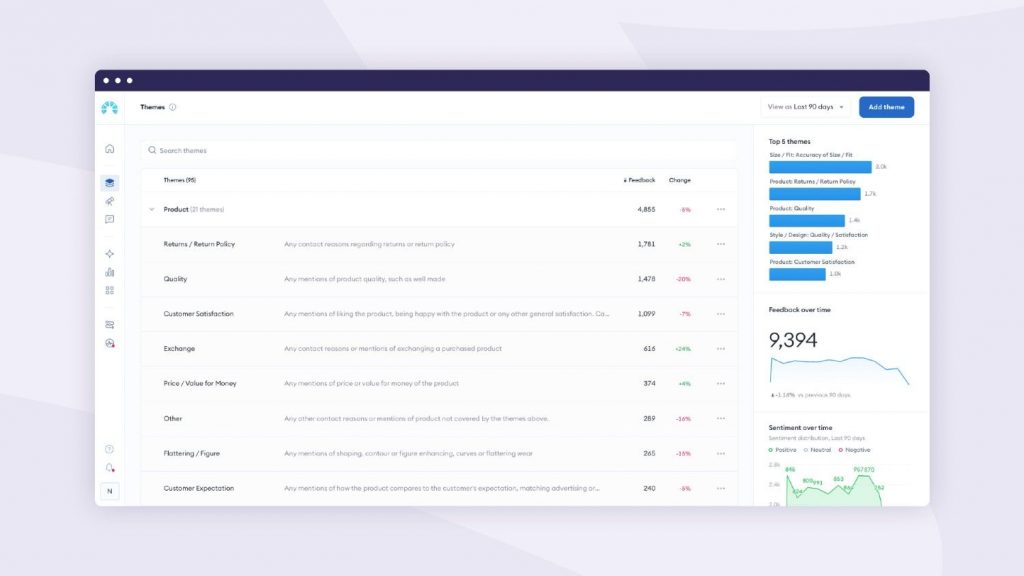
Its AI layer automatically tags and categorizes feedback by theme, so a spike in “checkout confusion” surfaces before it becomes a support ticket volume problem.
Pros:
- Aggregates feedback from surveys, reviews, support tickets, chat, and social into one view
- AI-powered theme detection and trend tracking across all sources
- Shareable dashboards for cross-team visibility on CX insights
Cons:
- No self-serve free plan; custom pricing for enterprise
- Best value requires feeding multiple feedback sources into the platform
- Not a behavioral analytics tool; it doesn’t track what users do on-site
Capterra Rating: 4.5/5
Pricing: Custom. Contact Chattermill for a quote.
10. Zendesk: Best for Support-Driven CX Analytics
Zendesk’s analytics are strongest for teams whose primary CX data source is customer support. The platform tracks ticket volume, first-contact resolution, response time, and CSAT scores, and surfaces issues that generate the most support load.
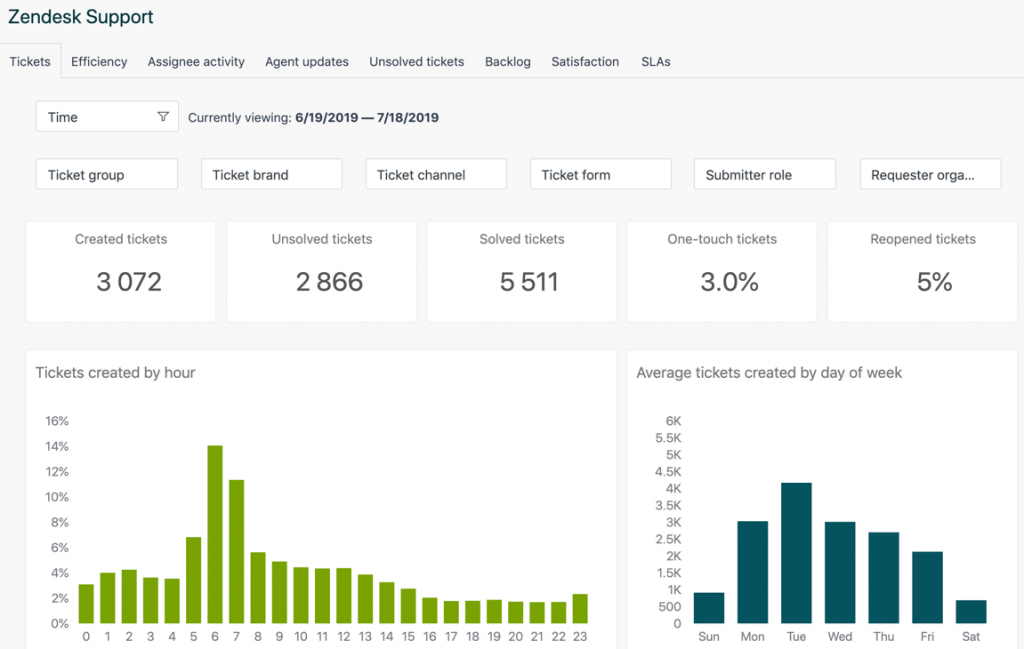
What Zendesk’s analytics don’t cover is the pre-support experience: what users were trying to do before they gave up and contacted support.
Pros:
- Native analytics across ticket volume, resolution time, CSAT, and agent performance
- Real-time dashboards with role-based visibility for CX and support leaders
- AI-powered ticket summarization and sentiment detection
Cons:
- Analytics are support-centric; they don’t capture behavioral or in-product CX data
- Full analytics capabilities require higher-tier plans
- Per-agent pricing scales steeply for larger support teams
Capterra Rating: 4.4/5
Pricing: Starts at $19/agent/month (Support Team). No free plan.
My Top 3 Picks in Customer Experience Analytics Tools
If I had to choose just three tools for different jobs, here’s how I’d break it down.
1. Qualaroo
My choice when the goal is understanding user behavior and intent in real time. It reaches users while they’re actively on your site or in your product, at the exact moment they hit friction or make a decision.
For product teams, CRO specialists, and CX researchers who need contextual feedback rather than retrospective survey data, that’s a different category of insight.
2. Mixpanel
My pick for product and growth teams that need precise behavioral data: funnel completion, cohort retention, and feature-level usage.
It’s the strongest standalone option for understanding what users do, especially once paired with a feedback layer to understand why.
3. Hotjar
My default for teams that want a fast, low-cost way to see where users click, scroll, and hesitate on a website, without a procurement process.
The free plan is generous, and the setup takes minutes, not weeks.
How Did We Evaluate These Tools?
The evaluation of products or tools chosen for this article follows an unbiased, systematic approach that ensures a fair, insightful, and well-rounded review. This method employs six key factors:
- User Reviews / Ratings: Direct user experiences, including ratings and feedback from Capterra, provide a ground-level perspective. This feedback is critical in understanding overall satisfaction and potential problems.
- Essential Features & Functionality: The value of a product is ascertained by its core features and overall functionality. Through an in-depth exploration of these aspects, the practical usefulness and effectiveness of the tools are carefully evaluated.
- Ease of Use: The user-friendliness of a product or service is assessed by focusing on its design, interface, and navigation. This ensures a positive experience for users of all levels of expertise.
- Customer Support: The quality of customer support is examined, taking into account its efficiency and how well it supports users in different phases, such as setting up, addressing concerns, and resolving operational issues.
- Value for Money: Value for money is evaluated by comparing the quality, performance, and features. The goal is to help the reader understand whether they would be getting their money’s worth.
- Personal Experience / Experts’ Opinions: This part of the evaluation criteria draws on the writer’s personal experience and the opinions of industry experts.
FREE. All Features. FOREVER!
Try our Forever FREE account with all premium features!
What Should You Look For in a CX Analytics Tool?
Not every team is missing the same thing. Use this framework to evaluate options against your specific gap.
| Decision Criteria | Questions to Ask |
| What Type of CX Data Are You Missing? | Behavioral (what users do), feedback (what they say), or both? |
| When in the Journey Do You Need Insight? | During the session? Post-interaction? After churn? |
| Who Are You Asking? | All visitors, specific user segments, logged-in customers, or churned accounts? |
| What Volume of Open-Text Feedback Do You Get? | If it’s high, AI analysis is a requirement, not a nice-to-have. |
| What Does Your Current Stack Include? | Does the new tool need to connect to your CRM, product database, or analytics platform? |
| What’s the Cost Structure? | Per-response, per-user, per-page-view, or flat fee? How does it scale with your traffic? |
| Who Will Act on the Insights? | Product, marketing, CX, or engineering? Does the tool route findings to the right team? |
The most common mismatch: teams pick a behavioral analytics tool when their core problem is not knowing what users are thinking at a specific moment.
Heatmaps tell you where users click. They don’t tell you why a user hesitated on the pricing page and then left.
How Should You Choose Between These Tools?
Start by identifying which failure mode is actually hurting your team, then match it to the fix rather than the tool with the most features on paper.
| Your Situation | What’s Actually Wrong | What to Prioritize |
| You have plenty of behavioral data, but no idea why users drop off | Missing an in-context feedback layer | A tool like Qualaroo’s Nudge™ surveys that asks users at the exact moment of friction |
| Feedback is piling up, and nobody has time to read it | No system for processing volume | AI sentiment analysis and theme detection over manual review |
| Your data lives in six disconnected tools | Fragmentation, not a lack of data | Integrations over features |
| You’re an e-commerce team chasing cart or checkout abandonment | Behavioral data shows where, not why | A funnel analytics tool (GA4, Mixpanel) paired with a behavioral layer (heatmaps, session recordings) and an in-context Nudge™ survey that fires at the hesitation point |
| You’re considering a heavy enterprise platform for a problem you haven’t scoped yet | Buying infrastructure before identifying the gap | A targeted feedback tool that gets you to insight faster, since not every CX program needs Medallia-level infrastructure to start |
For e-commerce teams specifically, the stack above works because each layer answers a different question. Behavioral data tells you where the abandonment happens.
A targeted Nudge™ survey at that exact step asks the question only the customer can answer: what stopped them.
Start With the Moment That’s Costing You the Most
Every team has one: the page with a high drop-off rate that nobody can explain. The onboarding step is where engagement falls off a cliff.
The checkout flow that loses users right before the confirmation screen.
Customer experience analytics tools give you the data to find that moment. The right customer experience analytics tools for your team depend on whether your blind spot is behavioral, qualitative, or both.
If you need to capture feedback while users are live on your site or inside your product, without waiting for them to respond to an email survey after they’ve already left, and if you want to see what users are doing on specific pages before you ask them anything, start with Qualaroo’s Nudges™, Heatmaps, and Session Recordings.
Frequently Asked Questions
What is the difference between CX analytics and product analytics?
Product analytics tracks how users interact with specific features and flows inside a product. CX analytics is broader, covering the full customer journey, including pre-purchase, support, and post-interaction feedback. Product analytics answers what users did. CX analytics adds how they felt about it and why it happened in the first place.
Which customer experience analytics tools are best for e-commerce?
The most useful combination is a funnel analytics tool like GA4 or Mixpanel, a behavioral layer like heatmaps and session recordings, and an in-context feedback tool for checkout and product pages. Qualaroo's exit intent and behavioral targeting are specifically useful for capturing why customers abandon carts or leave product pages without converting.
How do AI tools improve CX analytics?
AI serves two main functions in CX analytics: automating analysis of open-text responses through sentiment detection and theme clustering, and generating survey content through tools like Qualaroo's AI Survey Creator, which builds a survey from a plain-language description. Both cut down the manual work required to turn raw feedback into something you can act on.
What metrics should a CX analytics tool track?
The core CX metrics are NPS for loyalty, CSAT for satisfaction at a specific moment, CES for effort, churn rate, and customer lifetime value. Behavioral metrics like session length, drop-off rates, and funnel completion don't replace these, but they provide the context for why those scores are moving in the first place.
Why do most teams struggle to act on CX data even when they have it?
The most common pattern is data fragmentation: a survey tool for NPS, an analytics tool for traffic, and a support platform for tickets, none of which connect. The second is volume without clarity: open-text responses pile up, and nobody has time to read them. AI theme detection and a tool that routes insights to a specific owner solve both.
What survey questions work best for checkout abandonment?
Keep it to one or two focused questions fired at the exact moment of hesitation, such as "What stopped you from completing your order today?
" or "Was there anything missing from this page that would have helped you decide?" Shorter surveys fired at the right moment get more honest answers than long ones sent later.
What is the difference between a CX analytics tool and a survey tool?
A survey tool creates and distributes questionnaires and collects responses; that's its whole job. A CX analytics tool goes further: it tracks behavior, analyzes sentiment, segments respondents, integrates with product and CRM data, and routes insights to the teams that can actually act on them.
Do small businesses need a CX analytics tool?
Yes, especially for businesses that rely on repeat customers or word-of-mouth growth. Tools with free plans, like Qualaroo or Hotjar, let small teams capture behavioral data and run targeted surveys without a budget commitment, which matters most before you know which blind spot is actually costing you revenue.
FREE. All Features. FOREVER!
Try our Forever FREE account with all premium features!

 We'd love your feedback!
What did you like & how can we make it even better?
 Thanks for your feedback!
 Ask Your Question
Have a question? Get expert help to make your decision easier.