The most reliable way to improve survey response rate is to deliver surveys in-context, at the exact moment of the experience, rather than via email after the fact.
Everything else, length, language, targeting, timing, amplifies or undermines that foundation.
Most teams send surveys into the void and blame their audience when response rates stall.
The real problem is almost always structural: the wrong channel, the wrong timing, the wrong question order, or no evidence that prior responses ever changed anything.
Email suffers. In-app and contextual feedback channels are holding or improving.
The gap between teams getting 5% response rates and those getting 30%+ often comes down to a handful of structural decisions.
This guide walks through 25 specific, actionable ways to improve survey response rate across your website, app, and email programs.
What Is a Survey Response Rate?
A survey response rate is the percentage of people who complete your survey out of those invited or eligible to take it. You calculate it by dividing the number of completed responses by the number of people who received the survey, then multiplying by 100.
It’s worth distinguishing this from completion rate, which measures how many people who started the survey actually finished it.
Both matter.
- A low response rate means your audience isn’t engaging.
- A low completion rate means they’re starting and giving up.
What Is Considered a Good Response Rate for a Survey?
There is no universal benchmark, and teams that chase a single number often benchmark against the wrong peer set.
Here is how rates break down by channel in 2025, based on data from Clootrack and Kantar:
| Channel | Typical Response Rate |
| Email surveys | 15 to 25% |
| In-app (web app) surveys | 26 to 30% |
| In-app (mobile app) surveys | 34 to 38% |
| SMS surveys | 45 to 60% |
| Post-event in-person | 85 to 95% |
For SaaS specifically, a 22% email response rate already puts you ahead of roughly 75% of your peers, according to Clootrack’s 2025 benchmark research.
Anything above 30% is in the top quartile for most B2C sectors.
The more useful benchmark is representativeness, not just volume.
A 20% response rate, with churn-risk users well represented, will yield better product decisions than a 35% rate skewed toward your most loyal promoters.
Why Are Your Survey Response Rates Low?
Before fixing response rates, you need to know what’s actually suppressing them.
The most common culprits, based on community research and 2025 benchmark data, are:
- Wrong Channel: Teams default to email even when in-app or SMS would reach users 3 to 10x more effectively.
- Poor Timing: Surveys sent hours or days after an experience capture memory bias, not real sentiment.
- Survey Length: Every unnecessary question raises abandonment risk. Most respondents expect to finish in under 5 minutes.
- No Perceived Payoff: If users don’t believe their feedback changes anything, they stop responding. This is what researchers call “action fatigue,” not survey fatigue.
- Generic Targeting: Sending the same survey to your entire user base means many recipients find it irrelevant, and irrelevance kills response rates faster than anything else.
Knowing which of these is your primary issue determines which of the 25 strategies below to prioritize.
25 Strategies to Improve Survey Response Rates
1. Switch to In-Context Surveys Over Email by Default
The data on this is now unambiguous. Research from Clootrack’s 2025 benchmark studies shows that in-app surveys consistently outperform email by roughly 10x on response rate.
The difference comes down to context: email reaches users when the experience is already a memory, while in-app surveys catch them in the moment.
Email is still useful for certain segments and follow-up flows.
But if your primary feedback channel is still email-first, switching to in-context delivery (triggered on your website or inside your app during active use) will produce the single largest lift in response rates of any change you can make.
Tools like Qualaroo’s Nudge™ place a lightweight, non-intrusive survey inside the user’s active experience rather than interrupting them with an email they may read three days later.
Here’s a complete overview of what a Nudge is and what Qualaroo does:
2. Trigger Surveys at the Moment of Experience
The closer your survey is to the actual event, the more accurate and the more likely to be completed it will be.
A satisfaction survey sent immediately after a user completes onboarding, resolves a support ticket, or makes a purchase will consistently outperform the same survey sent 24 hours later.
The impact of getting timing right extends beyond response rate.
When Hootsuite used Qualaroo to trigger contextual in-app surveys at the right moment in the user journey, they saw a 16% lift in conversion, with statistical significance at 98%.

Map your key moments (onboarding completion, first value delivery, upgrade decision, churn signal) and set triggers to match them.
3. Use Behavioral Targeting to Reach the Right User at the Right Time
One of the fastest ways to tank your survey response rate is to show the same survey to everyone at once.
Respondents who find a survey irrelevant don’t just skip it. They develop a bias against your future surveys.
Behavioral targeting lets you segment by:
- URL or page (ask checkout abandoners a different question than active users)
- Visit frequency (ask first-time visitors vs. returning users different things)
- Scroll depth or time on page (trigger after 60 seconds of engagement, not immediately on load)
- Session-based behavior (show a feedback prompt only after a user completes a specific action)
- User attributes (role, plan type, account age)
This is where Qualaroo’s targeting engine becomes operationally significant:
The platform supports targeting by cookie, custom variable, domain, subdomain, and visit history, which means you can build specific, relevant micro-surveys for each segment instead of blasting a generic one to everyone.
4. Keep the Survey Under 5 Minutes
A 2025 Infeedo research indicates that surveys beginning with easy, closed-ended questions (such as multiple-choice) achieve higher completion rates than those starting with open-ended or cognitively demanding ones.
The practical rule: aim for 5 to 7 questions for a contextual in-app survey, and fewer than 10 for an email survey where there’s no real-time context to sustain engagement.
If your question list is longer, ask yourself which questions are truly driving decisions. Remove the rest.
5. Start With the Easiest Question
Cognitive ease is a real behavioral driver. When people see an easy first question, they’re more likely to commit to the survey and continue through to completion.
Use a simple rating scale, a yes/no, or a multiple-choice opener. Save open-ended questions for the end, where respondents who’ve already invested effort are more willing to write.
6. Personalize the Survey Invitation
Peer-reviewed research in the International Journal of Social Research Methodology found that personalization increases web survey response rates by 8.6 percentage points on average.
A 2025 study by Clootrack found personalized subject lines lift email open rates by approximately 26%.
Personalization doesn’t have to be complex.
Using a recipient’s first name, referencing a recent action they took (“How was your onboarding call last week?”), or framing the question around their specific role or plan type all signal that this survey was meant for them, not mass-distributed.
When using Qualaroo’s Identity API, you can connect survey responses to real user attributes (email, customer ID, plan type) and personalize targeting accordingly, making every survey feel contextual to that specific user’s journey.
7. Be Transparent About Survey Length Upfront
Telling respondents how long a survey takes before they start increases completion rates.
This transparency reduces the fear of an open-ended time commitment, which is one of the most common reasons people don’t start a survey.
Include an estimated time in the invitation and a progress bar inside the survey. Showing “Question 3 of 5” reassures respondents that the end is near and sustains the motivation to finish.
8. Use Simple, Plain Language in Every Question
Complex phrasing is one of the most underrated drivers of abandonment. When a respondent has to re-read a question to understand it, many simply close the survey.
Avoid technical jargon, double-barreled questions (asking two things in one), and leading language that suggests a preferred answer.
Test every question by asking: would someone who has never spoken to your team understand this immediately?
A useful reframe: instead of “How would you rate the efficacy of our onboarding communication protocols?”, ask “How easy was it to get started after signing up?”
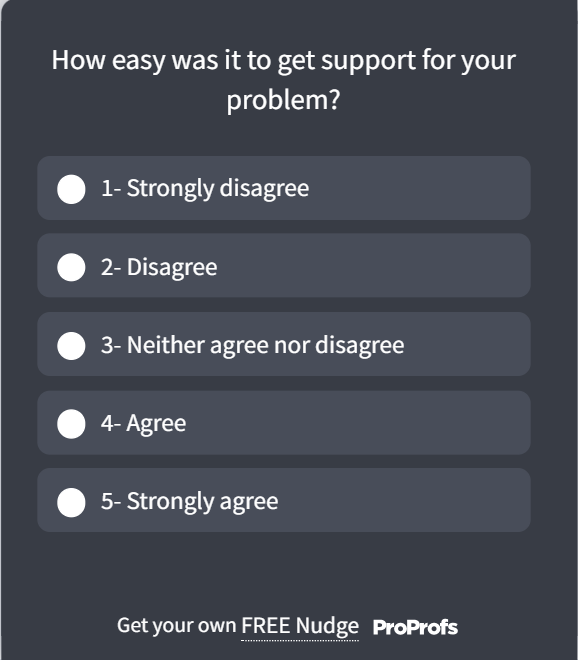
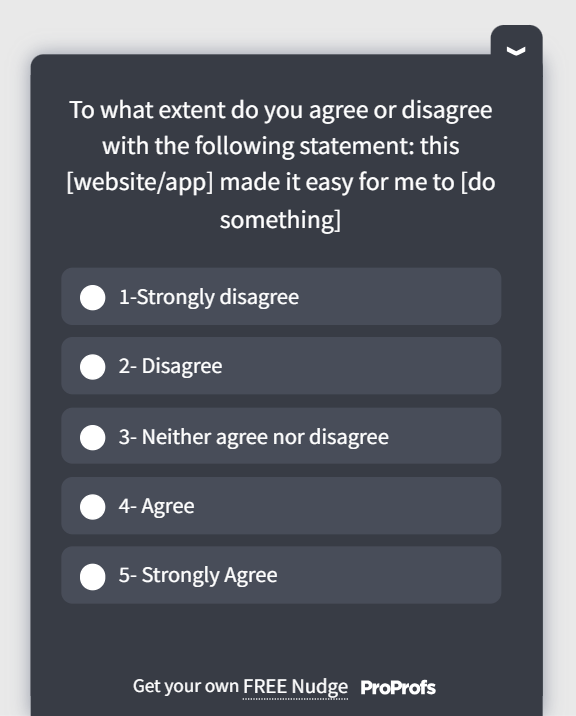
9. Prioritize CES Surveys for Highest Response Rates by Survey Type
Here’s something most teams overlook: the type of survey you choose affects response rate as much as how you deliver it.
CES (Customer Effort Score) surveys consistently outperform NPS on response rate because they ask about something specific and recent (“How easy was it to resolve your issue today?”), which respondents can answer in seconds without much deliberation.
Here’s a CES survey template you can use:
NPS asks for an overall relationship judgment, which takes more mental effort and is easier to defer.
The practical implication: use CES for post-support or post-onboarding moments where response rate matters most.
Deploy NPS surveys via in-app delivery to close the gap that email-based NPS creates.
10. Send Survey Reminders, Once
A single, well-timed reminder increases response rates without the backlash that comes from repeated follow-ups.
Send the reminder 3 to 5 days after the initial invitation, to non-responders only. Change the subject line and slightly reframe the ask.
Multiple reminders from the same template signal automation and reduce trust. One reminder with a human-feeling subject line is almost always more effective than two or three.
11. Offer Incentives That Match the Effort
Incentives work, but proportion matters.
Gallup’s 2025 research on survey participation found that pre-incentives, meaning rewards offered before the survey is taken rather than after, can significantly improve response rates by triggering a social obligation to reciprocate.
For short in-app surveys, you generally do not need monetary incentives.
But for longer research surveys (10 minutes or more), small rewards (gift cards, early feature access, loyalty points) meaningfully increase participation.
An alternative approach: frame it as collective impact. “For every completed survey, we’ll donate to [cause]” performs well with socially motivated audiences who aren’t moved by personal rewards.
12. Avoid Over-Surveying the Same Users
Survey throttling is not optional. Bombarding the same users with repeated surveys creates a specific type of disengagement that is harder to reverse than plain disinterest.
Set a minimum interval between surveys for the same respondent (typically 30 to 60 days for full relationship surveys, shorter for transactional ones).
Coordinate across teams so your product, CX, and marketing functions are not simultaneously surveying the same user list.
Qualaroo’s throttling settings let you control exactly how often a Nudge™ is shown to a specific visitor, preventing overlap and protecting the respondent experience at scale.
13. Make Every Survey Mobile-Friendly
Mobile users respond at significantly higher rates than desktop users when surveys are designed for the format.
The difference is not the channel itself but the design: tap-friendly inputs, minimal scrolling, and no text-heavy grids make the difference between a survey someone completes in 30 seconds and one they close immediately.
Use rating scales, yes/no toggles, and single-question screens. Avoid open-text fields on mobile unless it’s the final question. Test every survey on a smartphone before deploying.
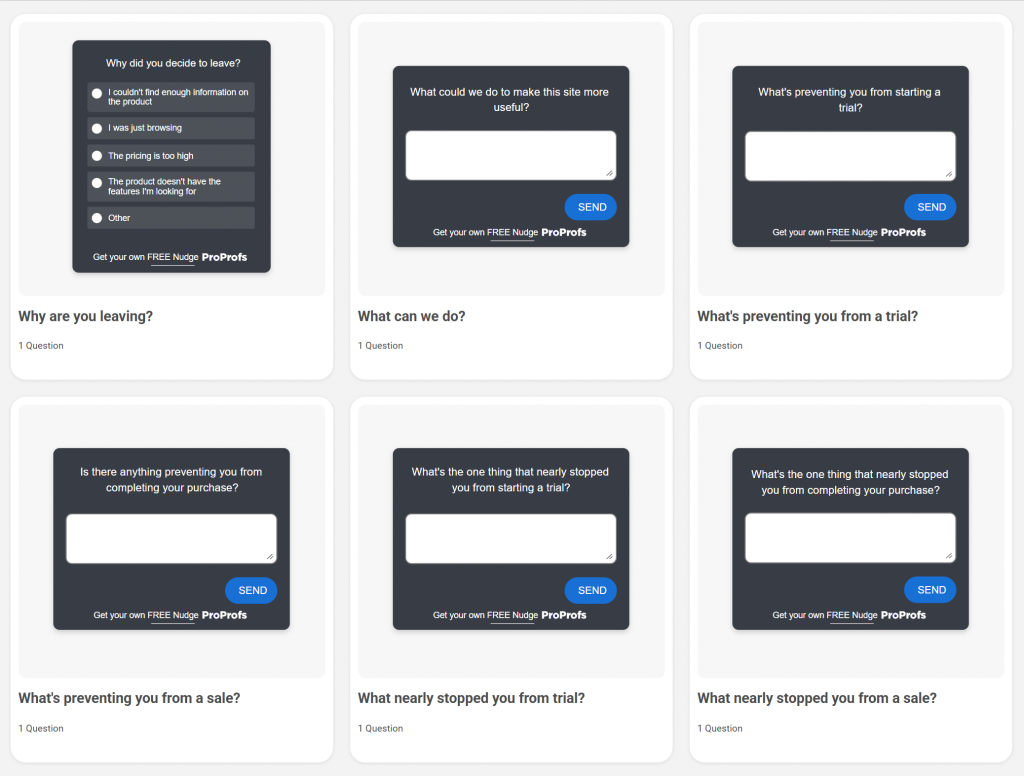
14. Use Exit Intent Surveys to Capture Departing Users
Exit-intent surveys fire just before a user leaves a page.
They’re one of the highest-signal feedback moments you can capture because the user is in the middle of a decision, not reflecting on one from the past.
Use them on pricing pages to understand objections, on checkout abandonment pages to capture purchase barriers, and on cancellation flows to identify the real reason for churn.
The timing is inherently relevant, which drives higher engagement than passive page widgets.
Here are a few exit-intent survey templates you can use:
15. A/B Test Your Survey Timing and Placement
There is no universally “best” time to send a survey. B2B audiences often respond best mid-morning on weekdays. B2C audiences have different patterns. Time zones matter for global teams.
Run A/B tests on send time (morning vs. afternoon), survey placement (center modal consistently outperforms corner placements for in-app surveys), and invitation subject lines.
Build a testing cadence rather than choosing based on assumptions.
16. Use Skip Logic to Shorten the Path for Each Respondent
Skip logic routes respondents to only the questions relevant to them based on prior answers. A user who answers “No” to “Have you used our support chat?” should not see five follow-up questions about the support chat experience.
This keeps survey length subjectively shorter for each individual respondent, even if the full survey has many branches. It also signals respect for their time and the relevance of the questions.
Here’s how you can use skip logic:
17. Segment Your Audience Before Sending
Sending the same survey to churned users, new users, and long-term power users is a category error. Each group has different experiences, different vocabulary for describing them, and different motivations for participating.
Segment by lifecycle stage, product usage, plan type, or account age. Create distinct survey flows for each. The investment in segmentation pays off in both response rate and data quality.
One practical advantage of segmenting before you survey: when free-text responses come in by segment, patterns emerge much faster.
Qualaroo’s AI Sentiment Analysis automatically categorizes open-ended responses by sentiment and surfaces the most common themes in each segment, so you’re not manually reading through 400 answers to find out what new users are struggling with vs. what churned users cite as their reason for leaving.
Here’s how it works:
A practical targeting table to guide your segmentation:
| Audience Segment | Best Survey Trigger | Recommended Format |
| New users (first 7 days) | After the first key action is completed | 2 to 3 questions, in-app |
| Power users (30+ sessions) | Monthly, during active use | NPS + one open-text follow-up |
| At-risk / churning users | After 14 days of inactivity | Exit intent or email, 1 to 2 questions |
| Churned users | 3 days post-cancellation | Email, incentivized |
| Post-support interaction | Within 1 hour of ticket close | CSAT, single question |
18. Close the Feedback Loop Visibly
Culture Amp CEO Didier Elzinga has made this point directly: people don’t get survey fatigue, they get action fatigue. The disengagement comes when they answer surveys and see no evidence anything changed.
After each major survey cycle, communicate publicly what you heard and what you changed because of it. A simple “You said, we did” email or in-app notification to respondents measurably improves participation in the next survey. It also builds the trust that makes future surveys feel worth completing.
19. Use Multi-Channel Delivery
Different segments live on different channels. Combining email with in-app prompts consistently produces more total responses and a more representative dataset than either channel alone.
For teams managing multiple client sites (a key Qualaroo agency use case), Qualaroo’s master account structure lets you coordinate multi-channel feedback across multiple properties without duplicating setup work for each client.
20. Target Active Customers, Not Your Entire List
The fastest way to inflate your denominator and deflate your response rate is to survey contacts who haven’t engaged with your product in months. They’re unlikely to respond, and their non-response skews your dataset toward disengagement.
Clean your list. Remove users who haven’t been active in 90 days (adjust based on your retention curve). Focus your survey invitations on engaged users for relationship surveys, and use targeted exit-intent or cancellation surveys to capture signal from disengaged users specifically.
21. Communicate Why You’re Asking and How the Data Will Be Used
People want to know why you’re asking before they answer. If your survey lands without context, they assume it’s generic, and generic gets ignored. Before respondents answer, they want to know: why is this team asking me, why was I selected, and what happens to my answers.
Address all three in your survey introduction or invitation. A two-sentence explanation (“We’re asking our most active users to help us improve onboarding. Your answers will go directly to our product team.”) increases both response rate and answer quality.
22. Use a Progress Bar in Multi-Step Surveys
Progress indicators reduce abandonment during multi-step surveys. Knowing they’re on question 3 of 7, respondents can make an informed decision about whether to continue, and most do, because they’ve already invested effort.
This is particularly important for longer research surveys where context cannot carry engagement the way a short in-app Nudge™ can.
23. Set the Right Frequency for Each Audience
A useful frequency framework to apply:
- Relationship surveys (NPS, overall satisfaction): no more than once per quarter per user
- Transactional surveys (post-support, post-purchase): within 1 hour of the interaction, not repeated for the same transaction
- Research surveys (feature discovery, UX): maximum once every 45 days per user
Match frequency to interaction cadence. B2B users with monthly touchpoints should be surveyed less often than daily-active B2C users.
24. Let Respondents Compare Their Responses to Peers
Showing aggregate results (“67% of users said they found onboarding straightforward”) gives respondents a sense of social context and investment in the data.
This is particularly effective in B2B settings where users care about how they compare to industry peers. It reframes the survey from a favor being asked of them to a shared knowledge-building exercise they belong to.
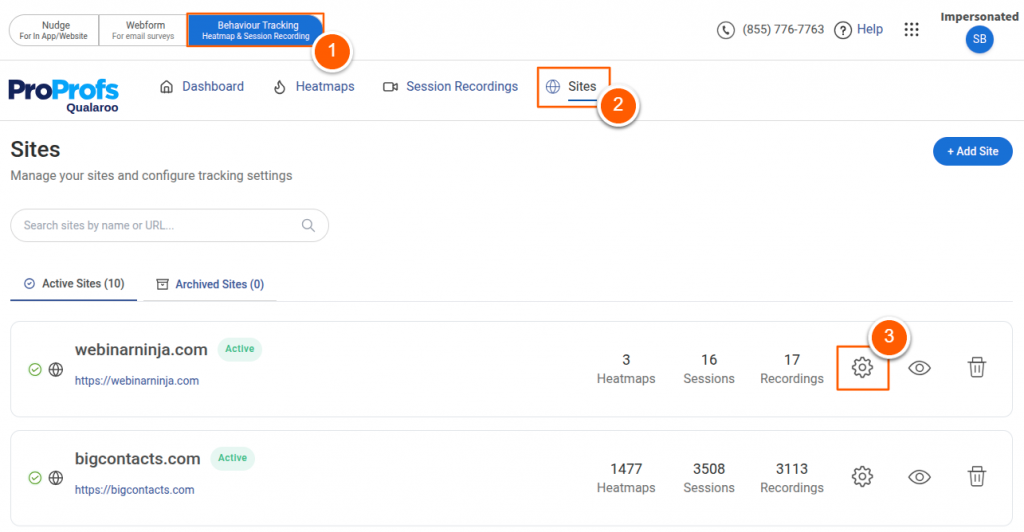
25. Use Heatmaps and Session Data to Inform Survey Targeting
If you’re not sure where to place your surveys or which pages to trigger them on, behavioral analytics gives you the answer directly.
Qualaroo’s built-in Heatmaps show exactly where users click, scroll, and drop off across every page.
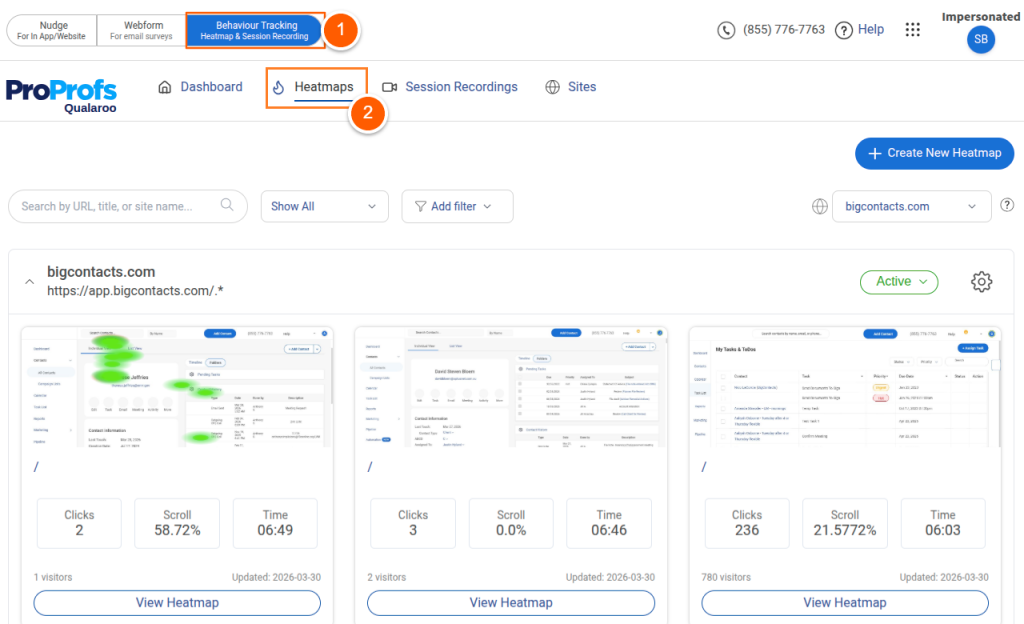
Session Recordings capture the full user journey, including hesitation points and rage clicks, giving you the behavioral signal to place contextual surveys precisely where friction is happening rather than guessing.
A product manager who sees users consistently dropping off at a specific step in a flow can use that data to trigger a one-question survey at exactly that step, capturing the “why” behind the behavior the heatmap reveals.
FREE. All Features. FOREVER!
Try our Forever FREE account with all premium features!
How Do You Create the Perfect In-Context Survey With Qualaroo?
The 25 strategies above tell you what to do. This section shows you how to do it inside Qualaroo, step by step, from blank slate to a live Nudge™ targeting the right user at the right moment.
An in-context survey is one that appears to the right person, on the right page, at the right moment in their session. It’s not a popup that fires the second someone lands on your homepage.
It’s a targeted Nudge™ that appears when a user has just completed a specific action, visited a specific page, or crossed a behavioral threshold you defined.
Here’s how to build one that actually drives responses:
Here’s the detailed breakdown of steps. You’ll need a Qualaroo account to follow these steps. The free plan includes all targeting and trigger features covered here:
Step 1: Define Your One Question for This Moment
Before touching any settings, decide what one thing you want to learn from this specific user at this specific moment. In-context surveys work because they’re precise.
They fail when teams try to pack in five things at once.
A product manager running post-onboarding feedback should ask: “How easy was it to complete your first setup?”
A CRO team on a pricing page should ask: “What’s preventing you from choosing a plan today?” One moment, one question. Everything else is a follow-up.
You can directly choose readymade templates once you have defined your survey questions:
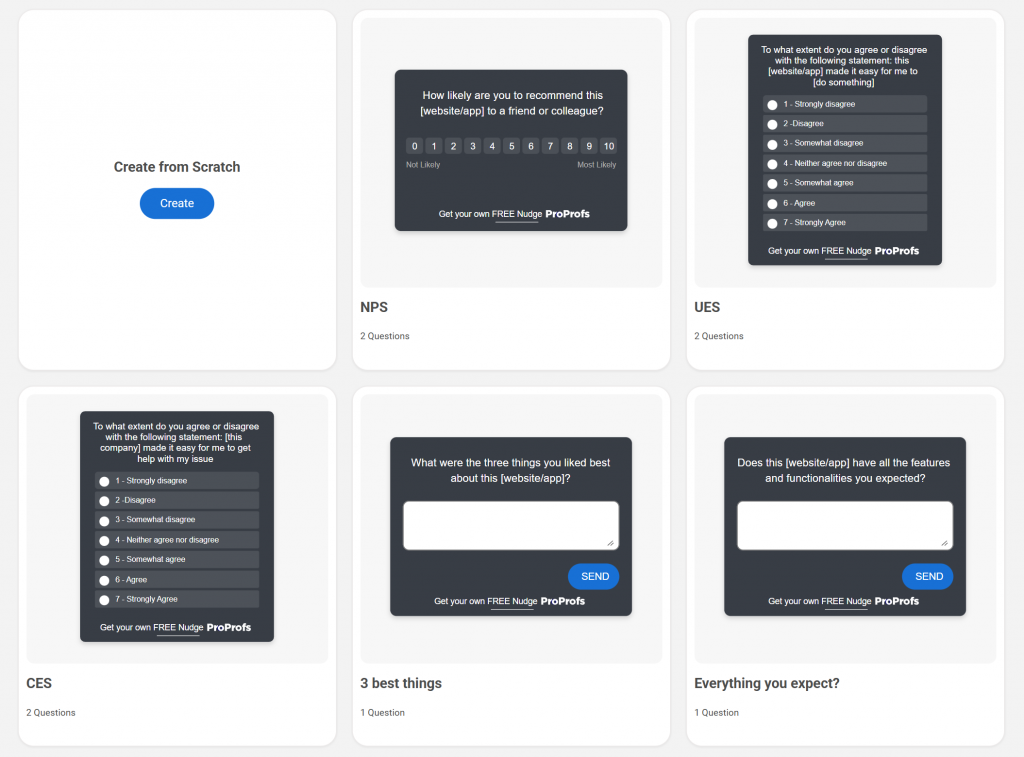
Step 2: Choose the Right Trigger in Qualaroo
Log into Qualaroo and create a new Nudge™. Under targeting settings, you’ll see several trigger options. Choose based on what moment you’re capturing:
| Trigger Type | When to Use It |
| Time on Page | Trigger after 30 to 60 seconds to catch engaged visitors, not bouncers |
| Exit Intent | Fire when the cursor moves toward the browser bar, ideal for pricing or cancellation pages |
| Scroll Depth | Trigger after a user scrolls 60 to 70% of a page, capturing readers who’ve actually engaged with the content |
| After Specific Action | Use Qualaroo’s custom event trigger to fire when a user completes onboarding, submits a form, or reaches a milestone |
| Visit Frequency | Show only to users on their 3rd or 5th visit, not first-timers |
Pick one trigger per Nudge™. If you need different questions at different moments, create separate Nudges™ for each.
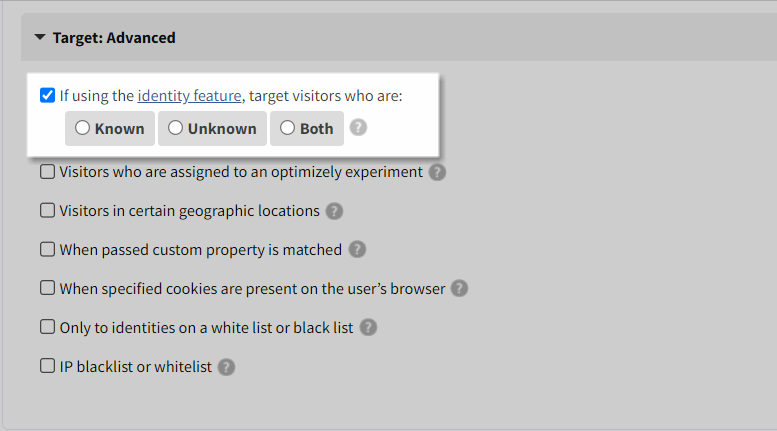
Step 3: Target the Right User Segment
Qualaroo’s targeting layer lets you filter who sees the Nudge™ beyond just page and timing. Under the audience settings, define your segment using one or more of these filters:
- URL Targeting: Show the survey only on a specific page (your pricing page, your checkout confirmation, your app dashboard).
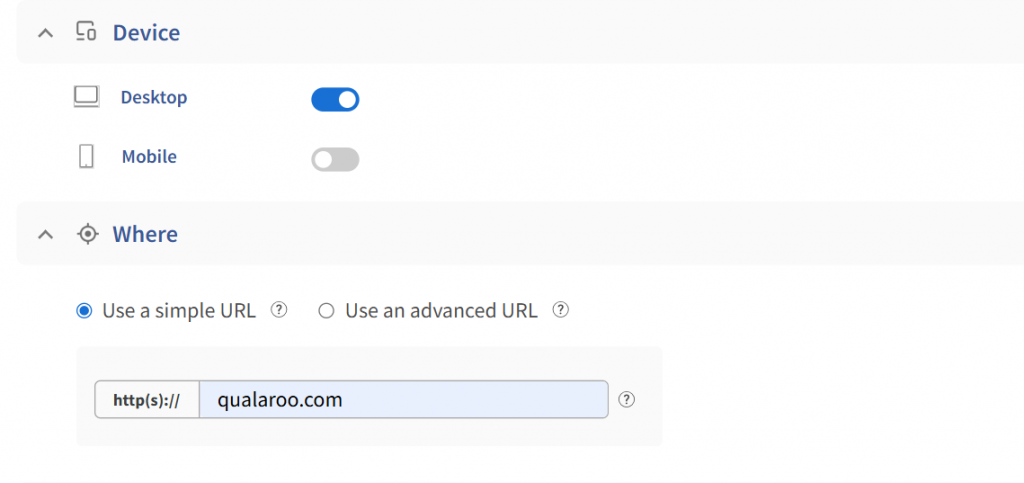
- Cookie-Based Targeting: Show to users who have a specific session attribute, such as plan type or account age, if you’re passing these through cookies.
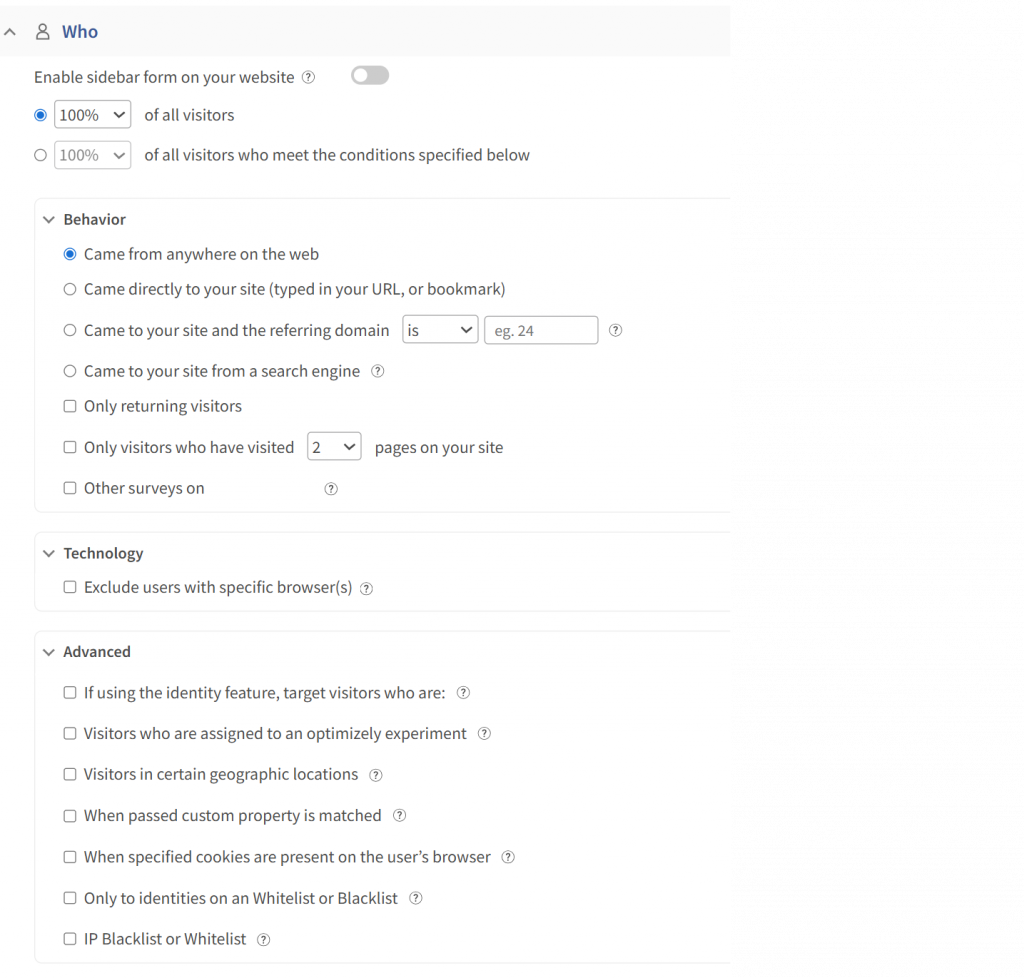
- Identity API: If you’ve added Qualaroo’s one-line Identity API (_kiq.push([“identify”, “user@email.com”])), you can whitelist or blacklist specific user emails or customer IDs. This lets you survey only paying customers, trial users, or users on a specific plan without emailing them separately.
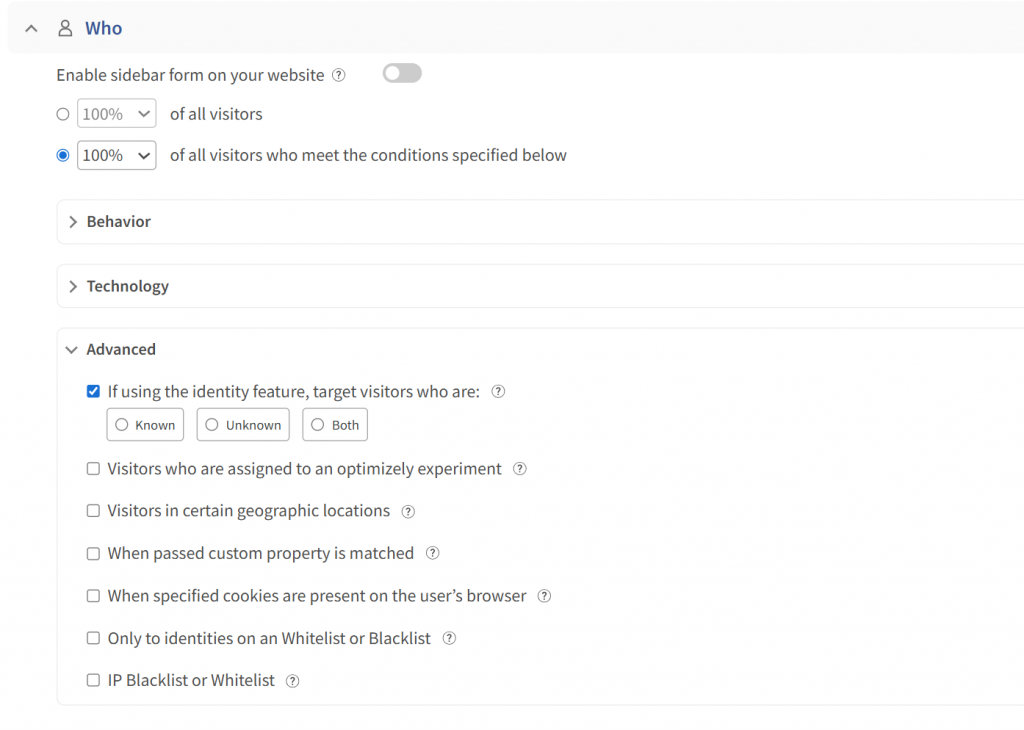
- Visit History: Show to users who have visited at least three times, filtering out one-time visitors who won’t have enough context to give useful feedback.
The narrower your audience definition, the more relevant the survey feels, and the more likely it is to be answered.
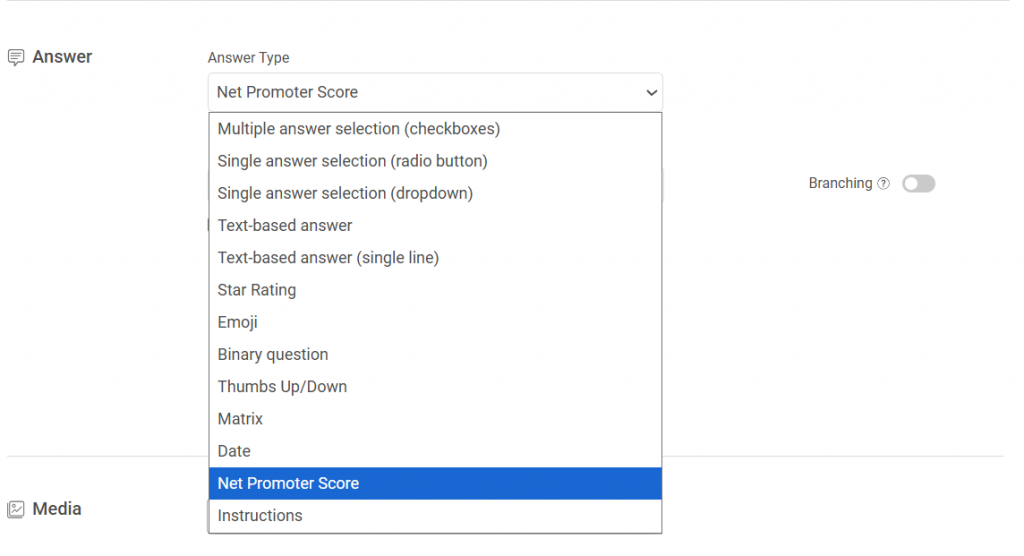
Step 4: Write the Question and Answer Options
Now write the actual survey. In Qualaroo’s survey builder, set your first question as a rating scale, multiple choice, or NPS depending on the moment. Keep it to one question per screen.
Follow the first question with a single conditional follow-up using question branching.
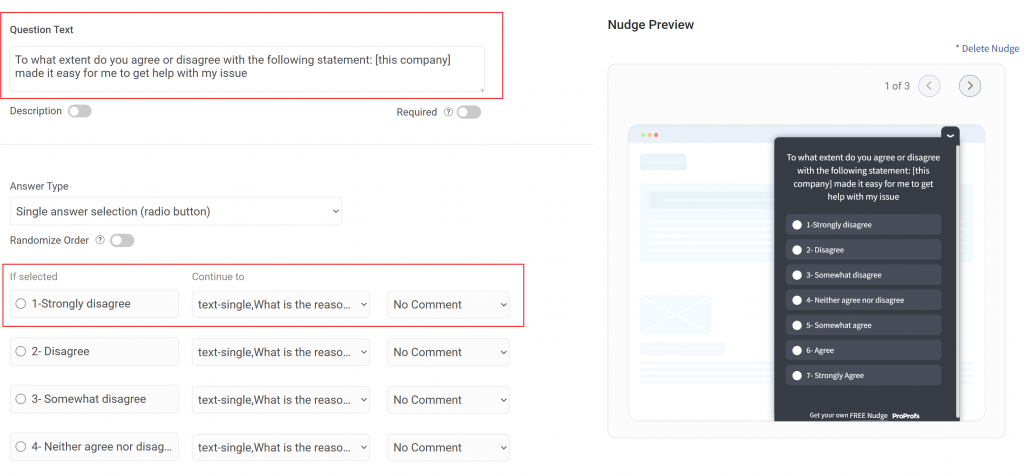
If a user rates their experience 3 out of 5 or lower, branch to “What could we have made easier?”
If they rate 5 out of 5, branch to “What did you find most helpful?” Skip logic means each user sees only what’s relevant to their answer, keeping the experience short and the data clean.
Apply Qualaroo’s branding settings to match your product’s color scheme and font. A survey that looks like it belongs to your product performs better than one that feels like a third-party widget dropped onto the page.
Step 5: Set Throttling to Protect the Experience
Under display frequency settings, enable survey throttling.
Set the minimum interval so the same user cannot see this Nudge™ more than once per 30 days (or adjust based on your survey cadence).
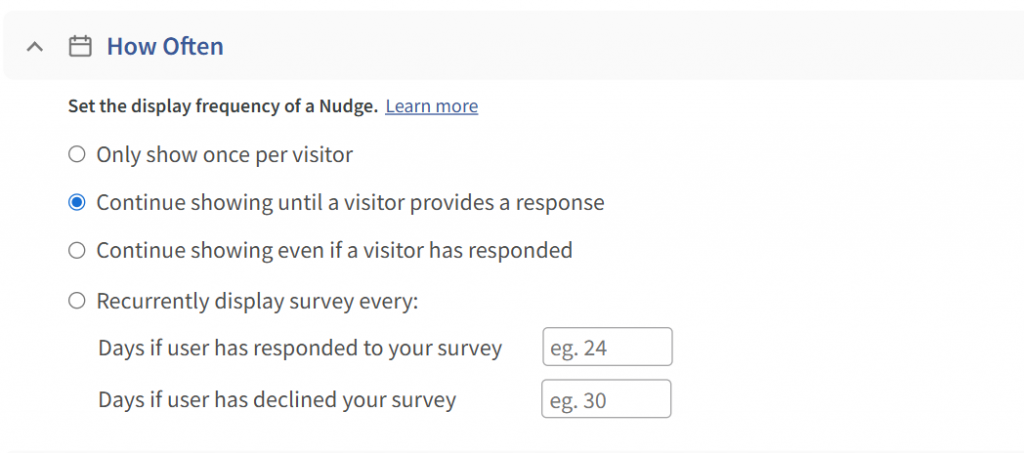
A user who just answered a checkout question should not see an NPS Nudge™ three pages later.
Step 6: Launch, Measure, and Refine
Publish the Nudge™ and let it run for at least 7 days before drawing conclusions. In the Qualaroo dashboard, monitor:
- Response Rate: Responses divided by views. Anything below 10% on an in-app contextual survey is a signal to revisit your targeting or question.
- Drop-Off Point: If users are starting but not finishing, check whether the follow-up question is too open-ended or takes too long to answer.
- Sentiment Distribution: Use Qualaroo’s AI Sentiment Analysis to review free-text responses without reading every answer manually. The Word Cloud surfaces the most common themes in minutes.
If response rates are low, the first thing to adjust is the trigger timing, moving from immediate to delayed (30 seconds on page) nearly always improves engagement.
If the question is being answered but the data isn’t useful, revisit the branching logic and answer options.
Ready-to-Use Survey Questions for Common Response Rate Scenarios
Copy these directly into your next survey:
Post-Onboarding (First 7 Days):
- “How easy was it to get started with [Product Name]?” (1 to 5 scale)
- “What’s the one thing that would make your first week better?”
Here’s a quick post-onboarding template:
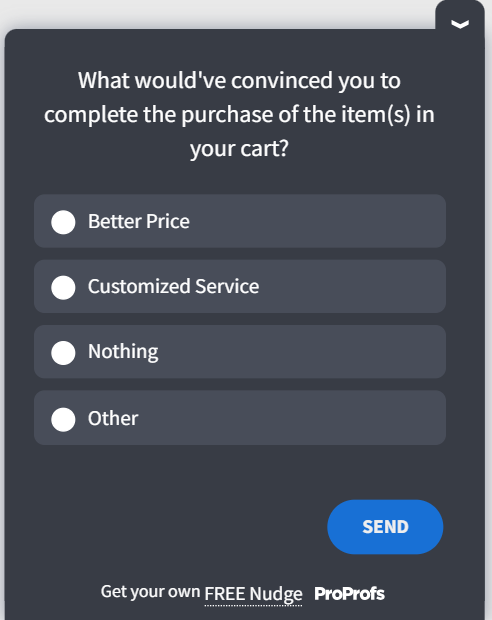
Exit Intent on Pricing Page:
- “What’s stopping you from getting started today?” (Multiple choice: price, features, not sure yet, evaluating alternatives, something else)
Here’s a quick exit-intent survey template:
Post-Support Ticket:
- “How easy was it to get your issue resolved?” (CES scale, 1 to 7)
Here’s a quick survey template for post-support feedback:
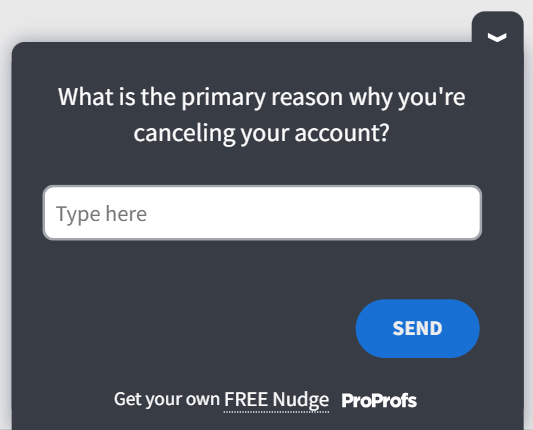
Churn or Cancellation:
- “What was the primary reason for canceling today?” (Multiple choice with open-text fallback)
- “What would have made you stay?”
Here’s a churn/cancellation survey template:
NPS Follow-Up (In-App):
- “How likely are you to recommend us to a colleague?” (0 to 10)
- “What’s the main reason for your score?”
Here’s an NPS survey template:

What’s Stopping You From Getting More Survey Responses?
If response rates are low, the answer is rarely “our audience just doesn’t want to help.” Most of the time, it’s a structural problem: wrong channel, wrong timing, or no visible follow-through on prior feedback.
The teams that sustain high response rates treat surveys as a two-way channel, not a data-extraction exercise.
They ask at the right moment, keep it short, and close the loop every time.
If you’re running surveys on your website or in your app and seeing response rates under 15%, try moving to in-app contextual delivery before adjusting anything else. That single change produces the largest lift for most teams.
Try Qualaroo and see how contextual, behavior-triggered surveys compare to what you’re running today.
Frequently Asked Questions
What is a good response rate for an online survey?
For email surveys, 15 to 25% is the accepted benchmark in 2025, according to Clootrack. In-app surveys deliver higher rates, ranging from 20 to 30% for web apps and higher for mobile. In B2B SaaS, a 22% response rate puts you ahead of roughly 75% of peers. Context matters more than chasing a single number.
How do I calculate my survey response rate?
Divide the number of completed surveys by the total number of people who received the survey, then multiply by 100. For example, 150 completions out of 600 invitations sent equals a 25% response rate. Count only fully submitted responses, not partial completions, unless your methodology specifically accounts for them.
Why are my survey response rates so low?
The most common causes are using email when in-app delivery would be far more effective, sending surveys too long after the experience, targeting the wrong audience with irrelevant questions, and never showing respondents that their previous feedback changed anything. Usually, one of these structural issues is the primary driver, not audience disinterest.
How long should a survey be to maximize response rates?
Keep it under 5 minutes. For in-app contextual surveys, 2 to 5 questions is the right range. For email research surveys, 7 to 10 questions is the ceiling before abandonment rates climb sharply. If every question on your list isn't directly driving a decision, it shouldn't be in the survey.
Do survey incentives actually improve response rates?
Yes, but the reward needs to match the effort. For short in-app surveys of 2 to 3 questions, incentives are rarely needed. For longer research surveys requiring 10 or more minutes, small rewards like gift cards or early feature access meaningfully lift participation. Gallup's 2025 research confirms pre-incentives are especially effective.
What is the difference between survey response rate and completion rate?
Response rate measures how many people invited to the survey submitted the survey. Completion rate measures how many who started actually finished every question. Both are worth tracking separately. A low response rate points to a targeting or channel problem. A low completion rate usually signals that the survey is too long or loses relevance mid-way.
How often should I survey my customers?
For relationship surveys like NPS, no more than once per quarter per user. For transactional surveys after support or purchase, once per interaction within 1 hour. For UX or feature research, no more than once every 45 days per user. Coordinating frequency across product, CX, and marketing teams matters as much as any individual survey cadence. For a full breakdown, see our guide on [survey fatigue](INTERNAL LINK: Qualaroo survey fatigue guide or survey frequency blog).
What is survey throttling, and should I use it?
Survey throttling controls how often the same user sees a survey within a set time window. It prevents a respondent from being hit with multiple surveys in a single session or week. Yes, you should use it. Without throttling, engaged users get over-surveyed, response quality drops, and future participation rates suffer. Qualaroo's throttling settings handle this at both survey and global levels.
FREE. All Features. FOREVER!
Try our Forever FREE account with all premium features!
 We'd love your feedback!
What did you like & how can we make it even better?
 Thanks for your feedback!
 Ask Your Question
Have a question? Get expert help to make your decision easier.