

When a customer decides to leave, they already know exactly why. The problem is, they rarely tell you unless you ask.
According to Zendesk’s 2026 Customer Service Benchmarks, 56% of dissatisfied customers rarely complain.
The rest walk out without a word, and you lose the exact insight that could have saved the next hundred customers from the same fate.
An exit survey gives you a direct line to that feedback. But most businesses either don’t ask, ask too late, or ask so many questions that nobody bothers to answer.
This guide fixes all three.
You’ll get a ready-to-use question set, a targeting framework for when and whom to ask, and a clear breakdown of how to turn exit feedback into a retention system rather than a spreadsheet nobody reads.
What Is an Exit Survey?
An exit survey is a short questionnaire shown to customers who are canceling a subscription, closing an account, or leaving a product. It captures their reason for leaving, their satisfaction level, and what might have changed their mind, directly at the moment of departure.
Exit surveys are different from standard feedback surveys because the timing is specific and the psychology is different.
A customer completing an exit survey has already made a decision. That means they are often more honest, more specific, and more willing to surface the real reason rather than a polished version of it.
This is the feedback your happiest users can never give you. And it is the kind that actually changes products, pricing, and support processes when you use it right.
When Should You Trigger Exit Surveys?
Timing is the variable most businesses get wrong.
Sending an exit survey email three days after someone cancels is like asking a passenger what went wrong with their flight after they’ve already landed, unpacked, and booked with a competitor.
Here is a targeting framework based on channel and moment:
| Channel | When to Trigger | Best For |
| In-Product (on Cancellation Page) | When the user clicks “Cancel” or “Delete Account.” | SaaS products, subscriptions |
| In-Product (Exit Intent) | When cursor movement signals that the user is about to leave | Pricing pages, trial upgrade prompts |
| 1 to 3 hours after cancellation is confirmed | Off-site users, e-commerce | |
| Email Follow-Up | 15 to 30 days after cancellation | More objective, less emotional feedback |
| On-Site Embed | On unsubscribe or account deletion path | E-commerce, newsletter churn |
For businesses running website exit surveys specifically, the on-site embed row applies most directly.
You embed the survey into the unsubscribe or account deletion page so the question appears in the same session where the decision was made, not in a follow-up email the customer may never open.
In-product triggers win because the experience is front of mind.
A customer trying to cancel right now has their frustration, their context, and their reasoning all active at once. That is when you get the honest answer.
By the time an email arrives the next morning, rationalization sets in, and detail is lost.
How Do You Segment Exit Survey Responses by User Type?
Not all churning customers are telling you the same thing. A power user who logged in daily for six months and then canceled is a completely different signal from someone who signed up, never activated a core feature, and quietly disappeared at the end of their trial.
Treating them with the same survey produces averaged-out, diluted data. Segmenting them produces two separate, actionable diagnoses.
Power users who churn signal a product problem or a competitive loss. Something broke, a competitor offered a capability you don’t have, or a pricing change crossed a threshold. These accounts deserve immediate CS follow-up and a survey weighted toward competitive and product questions: what changed, what the alternative offers, and what would bring them back.
Barely-engaged users who churn signal an onboarding or activation failure. They never reached the moment where the product clicked. The survey for this group should focus on what confused them, where they got stuck, and what they were hoping the product would do. This is your product education and onboarding data.
Use a custom variable tied to your product’s usage metric, such as sessions in the last 30 days, features activated, or actions completed, to route the two groups to different survey versions.
Power users (high usage variable) see one question set. Barely-engaged users (low usage variable) see another. The data you collect is cleaner, the patterns are sharper, and the fixes become obvious faster.
10+ Exit Survey Questions Should You Ask
The goal is not to ask everything. It is to ask the fewest questions that give you the clearest picture of why this person decided to leave and what you could realistically fix.
Here is a ready-to-use exit survey question set organized by objective. Mix and match based on your specific goals.
3 Questions to Uncover the Primary Reason for Churn
These are your highest-priority questions. Ask them first.
- What is the main reason you decided to cancel today? (Multiple choice: Too expensive / Missing features I need / Switching to another tool / Not using it enough / Technical issues / Other)
- Was there a specific moment or experience that led to this decision?
- What would have needed to be different for you to stay?
Here’s an exit survey template you can use:
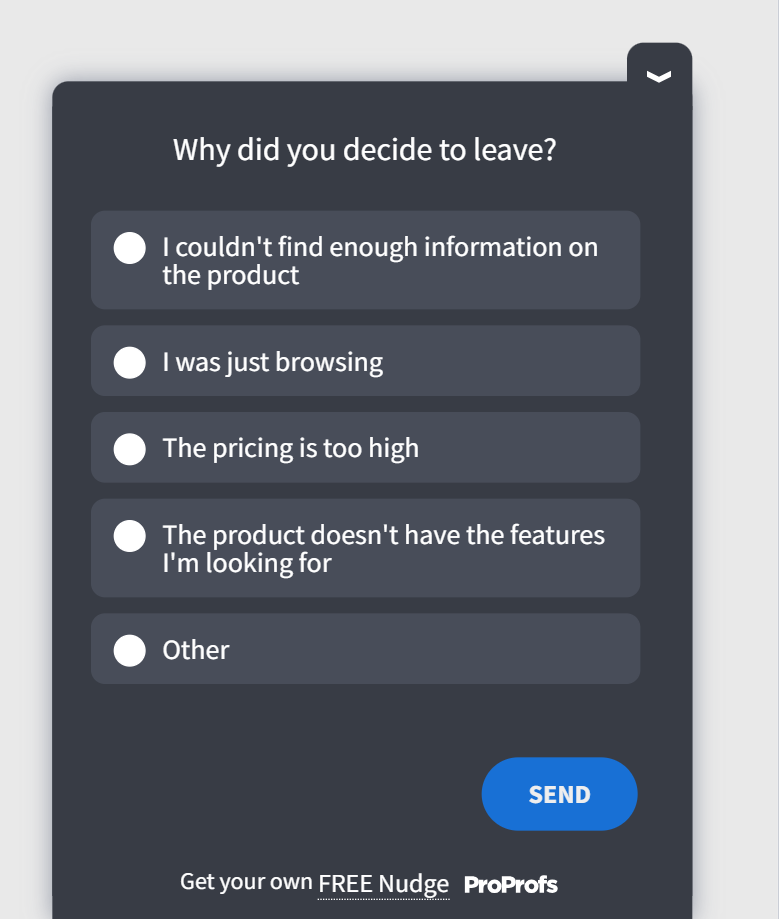
The first question should almost always be a forced single-choice, not a multi-select.
Multiple selection sounds more thorough, but it produces noisy data that is hard to prioritize.
A single forced choice tells you what mattered most.
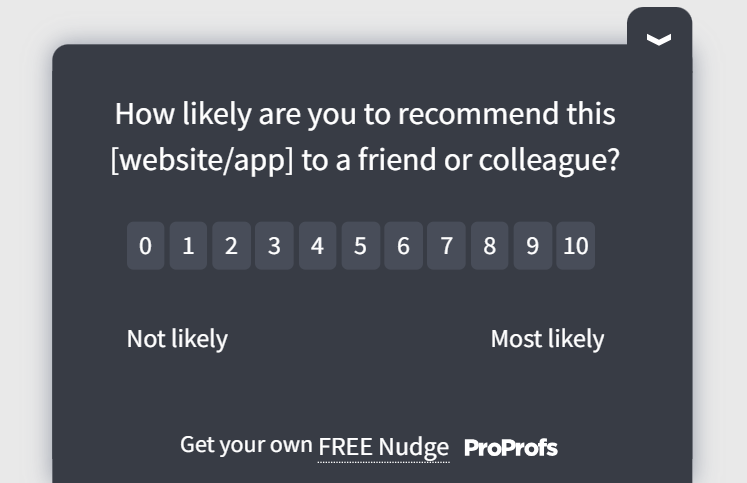
4 Questions to Measure Overall Experience
Adding an NPS question to your exit survey does two things.
It gives you a CX score you can compare with your ongoing NPS tracking to spot when sentiment began to drop.
And it segments departing customers: someone giving a 7 out of 10 is a very different win-back target than someone giving a 2.
- How would you rate your overall experience with [product name]? (1 to 5 scale)
- On a scale of 0 to 10, how likely are you to recommend [product name] to someone else even though you are leaving? (NPS)
- Which part of the product did you find most useful?
- Which part of the product was the most frustrating or confusing?
Here’s an NPS survey template:
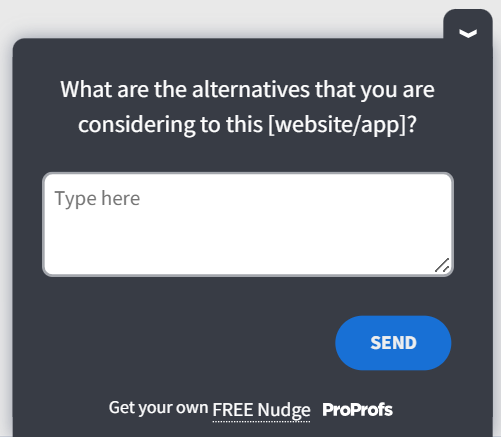
3 Questions to Understand the Competitive Landscape
These questions are gold for your product and marketing teams. They surface gaps in your value proposition that no internal roadmap review will catch.
- Are you switching to another tool? If yes, which one? (Optional open field)
- What does that tool offer that [product name] did not?
- How does our pricing compare to what you are moving to?
Here’s a competitive landscape exit survey template:
3 Questions to Assess Support and Onboarding
According to a 2024 Retently study, three main issues cause 53% of all customer churn: poor onboarding (23%), weak relationship-building (16%), and poor customer service (14%).
These questions target all three directly.
- Was our onboarding process clear and helpful?
- When you needed help, was our support team able to resolve your issue quickly?
- Is there anything we could have done earlier in your journey to prevent this?
The Best Exit Survey Questions to Reduce Churn
The single best exit survey question is deceptively simple:
“What is the main reason you decided to cancel today?”
That one forced-choice question, asked at the right moment, produces more actionable data than a 10-question survey sent via email three days after the cancellation.
But you cannot stop there.
The follow-up open-ended question, “What would have needed to be different for you to stay?” is where you find the specific, fixable insight.
Forced-choice answers tell you the category; open-ended answers tell you the details.
The highest-performing exit surveys use three questions in sequence:
- A forced single-choice question to categorize the churn reason
- An open-ended follow-up based on the answer to question one
- An NPS or CSAT score to benchmark sentiment
That structure captures the what, the why behind the what, and a score you can track over time, without burning the customer’s patience.
Here is how to set all of this up in under 15 minutes, without a developer.
How Do You Create an Exit Survey in Qualaroo?
Most teams build exit surveys using passive tools like Google Forms or post-cancellation email links.
The problem is timing: by the time the email arrives, the customer has moved on, rationalized their decision, and lost the emotional clarity that produces honest feedback.
Churnkey’s 2024 data estimates email exit surveys for churned customers achieve only a 1–2% response rate, with best-case open rates of ~40% and click rates of ~3%.
Qualaroo solves this with its Nudge™ technology, a non-intrusive in-product survey that triggers at the exact moment a customer signals cancellation intent/cart abandonment, while the reason is still front of mind.
It also supports advanced targeting by URL, user property, and behavior, so you are asking the right customer the right question at the right moment, not blasting a generic form to everyone who ever churned.
Setting up a live exit survey in Qualaroo takes under 15 minutes. No developer involvement after the initial script install. Here is the exact process.
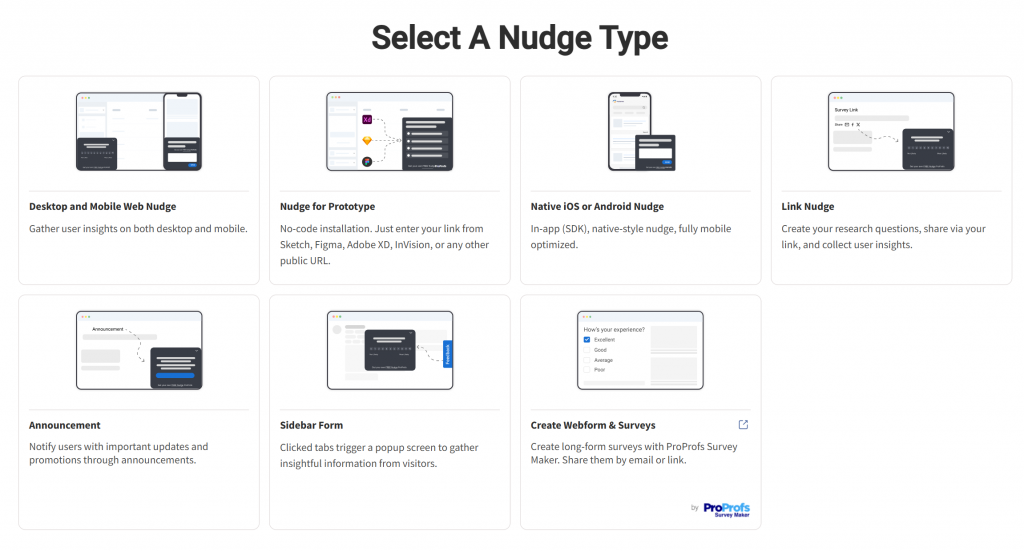
Step 1: Start a New Nudge™
From your Qualaroo dashboard, click “Create a Nudge™.”
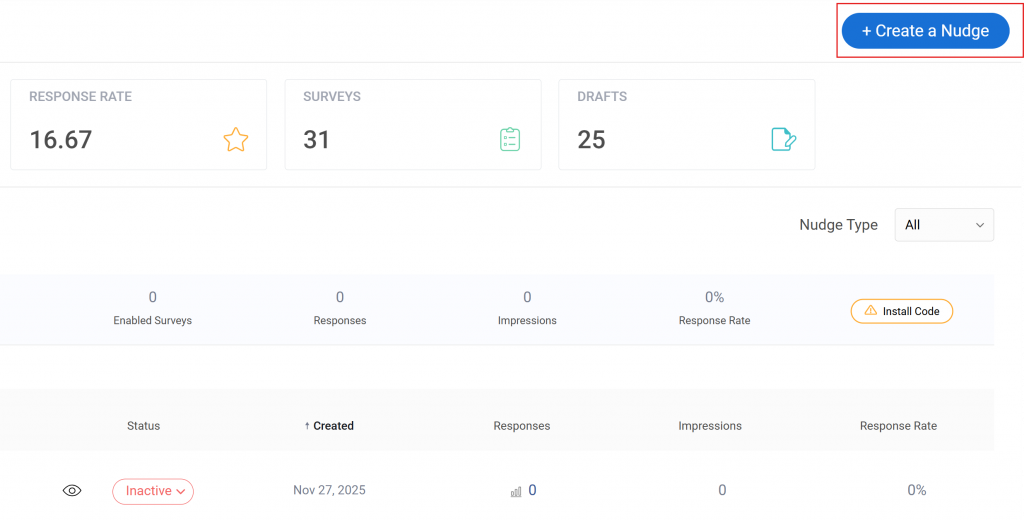
You will be prompted to choose a survey type. Select “Desktop and Mobile Web Nudge”.
Step 2: Choose a Template or Build From Scratch
Qualaroo’s template library includes pre-built churn and cancellation survey templates. Select the one that matches your goal, or start a blank one.
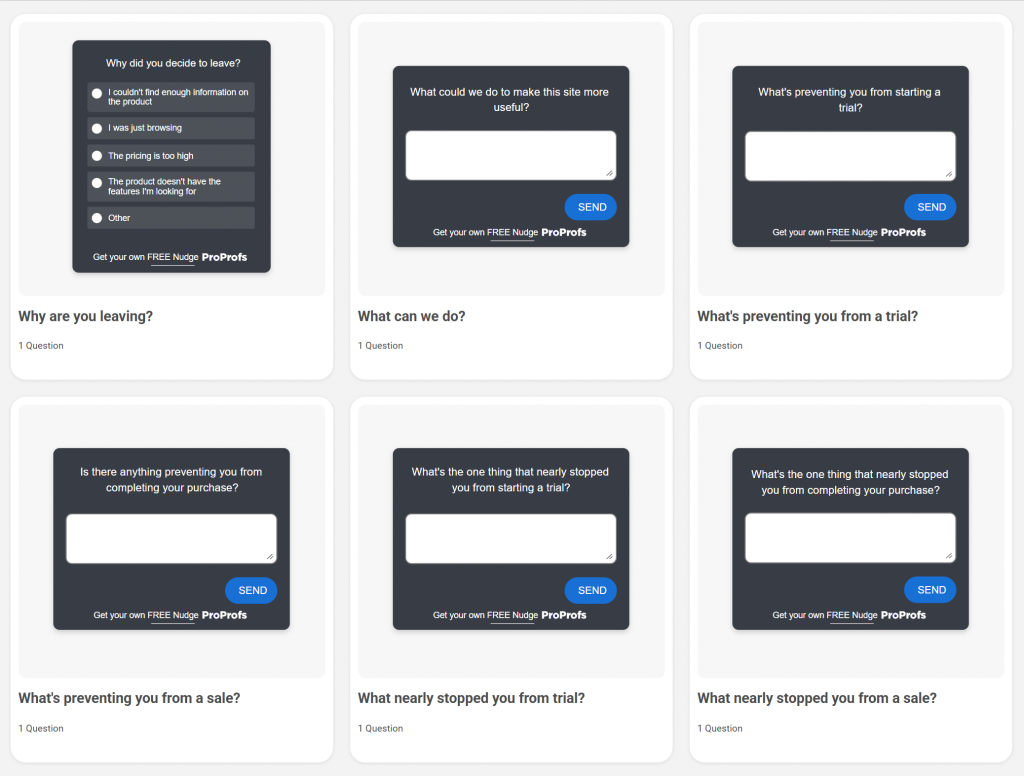
Either way, you are working inside a visual editor, not writing code.
Step 3: Add Your Questions
Add your primary churn reason question first. Use the “Single Answer Selection” question type.

Enter your answer options: Too expensive, Missing features, Switching to another tool, Not using it enough, Technical issues, Other.
Then add your follow-up open-ended question. Use question branching to connect each answer to a relevant follow-up. Here’s how:
A user who selects “Too expensive” sees a pricing question next. A user who selects “Missing features” sees a question about which specific features they need.
Add your NPS or rating question last.
Step 4: Set Your Targeting Rules
This is where Qualaroo’s advanced targeting comes into play. You can set the Nudge™ to appear based on:
- A specific URL (e.g., yourapp.com/account/cancel)
- A user action (e.g., clicking a “Cancel Subscription” button)
- A cookie value or custom variable (e.g., subscription tier, account age, usage level)
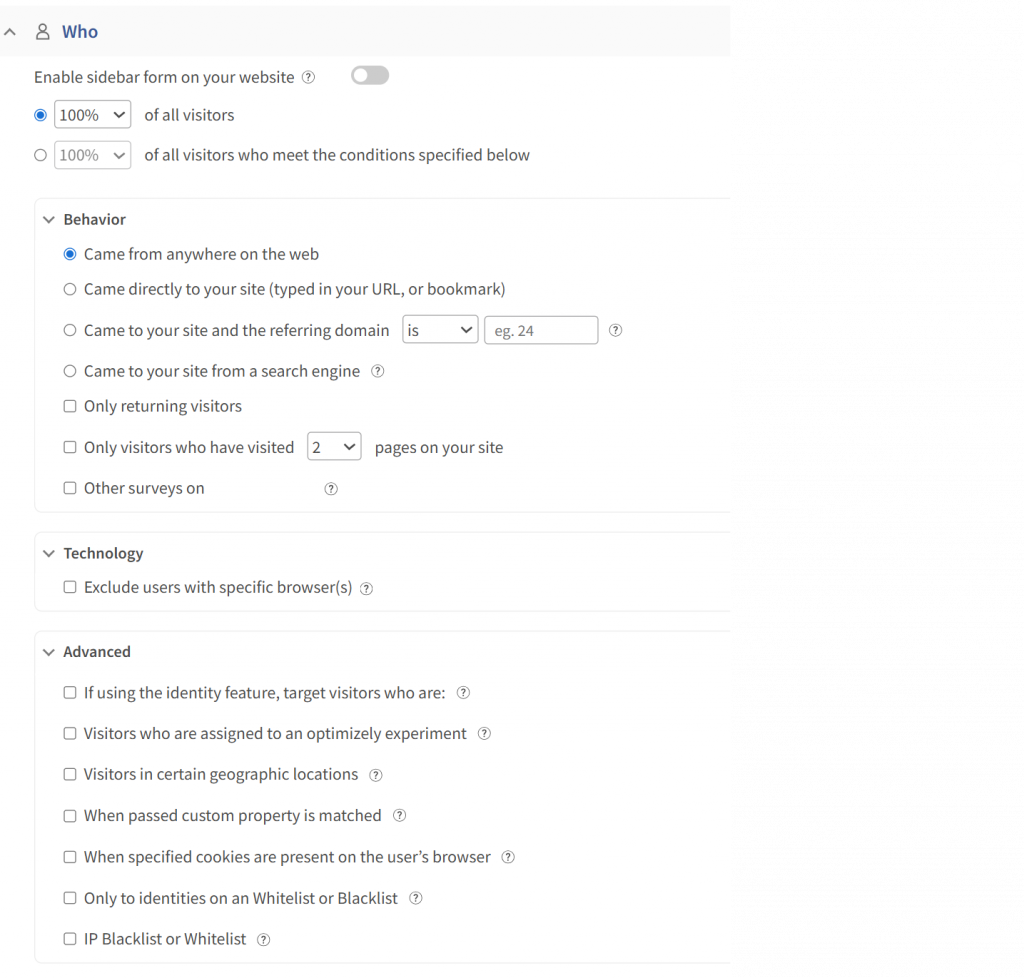
For churning customers, the tightest trigger is URL-based on the cancellation page, combined with a user property that filters for paid accounts only. Free users churning tell you something different and should be surveyed separately.
Step 5: Set the Display Rules
Choose when the Nudge™ appears: immediately on page load, after a set delay, or on exit intent.
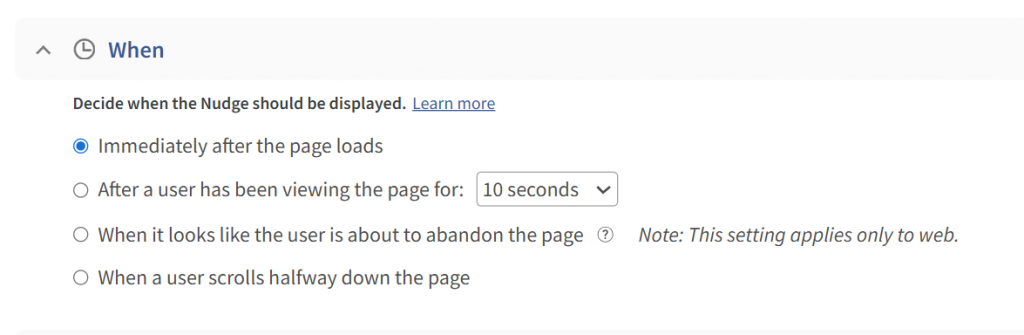
For cancellation pages, immediate on-page load works best because the user is already in the mindset of leaving.
A delay only gives them time to complete the cancellation before seeing the survey.
Set frequency rules so returning users who did not cancel are not shown the survey repeatedly.
Step 6: Enable Integrations
Connect Qualaroo to your CRM and Slack before you go live.
In the Qualaroo Integrations tab, link your Salesforce or HubSpot account so every exit survey response is automatically logged against the customer’s record.
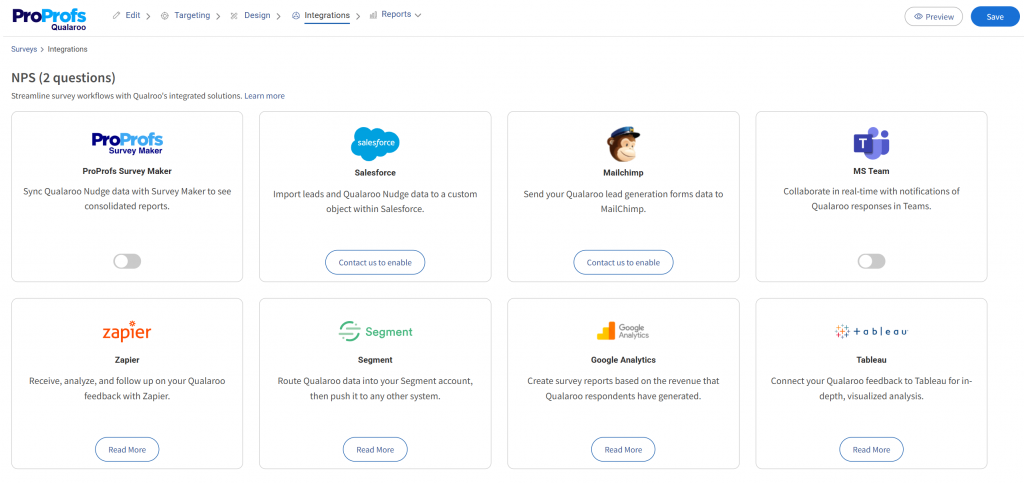
Add your Slack webhook so your CS team gets a real-time notification the moment a high-value account submits a churn reason.
This step is what separates a feedback tool from a retention system.
Step 7: Publish and Monitor
Click Publish. The Nudge™ goes live on your specified URL immediately. No code changes, no deployment. Head to the Analytics tab to monitor responses in real time.
Qualaroo’s AI Sentiment Analysis automatically tags open-ended responses as positive, neutral, or negative and surfaces the most common themes across your free-text answers, so you are not manually reading through hundreds of individual responses to find the pattern.
FREE. All Features. FOREVER!
Try our Forever FREE account with all premium features!
How Do You Use Exit Survey Data to Retain Customers?
Collecting the data is step one. Here is how to build a working loop from survey to action:
Step 1: Route Feedback in Real Time
The moment a survey is submitted, the data needs to reach the right person.
On Qualaroo, exit survey responses are routed automatically to the CRM and a dedicated Slack channel.
The CS team sees the feedback within minutes and can tag responses by priority: high-value customer, billing issue, product bug, competitive loss.
For product teams, route responses citing “missing features” or “technical issues” directly to the product backlog or a dedicated Slack channel monitored by the PM team.
For marketing, route “switching to competitor” responses to a segment in your CRM tagged for competitive win-back campaigns.
This is critical. A high-value customer citing “switching to competitor” needs a follow-up within hours, not days. By then, their onboarding with the new tool has started.
KingsPoint placed a feedback survey on their checkout page asking a single question: “What stopped you from completing your order today?”

The responses revealed a JavaScript error that prevented Firefox users from completing purchases. That one finding was worth approximately $60,000 in recovered annual revenue. Generic analytics showed a drop-off.
The exit question named the cause.
Step 2: Categorize and Prioritize by Impact
Not every churn reason is equally fixable or equally costly. Build an impact score for each reason category:
Impact = Frequency of that churn reason × Average customer value of those accounts × Addressability
A churn reason cited by 5% of users but accounting for 40% of churned ARR is prioritized over one cited by 30% of users who were all on free trials.
Step 3: Act on Patterns, Not Individual Responses
Individual responses tell you what one person experienced. Patterns tell you what is broken. Review exit survey data monthly across the full churned cohort.
Look for the 20% of reasons that are driving 80% of departures.
That kind of pattern analysis used to mean hours of manual work, reading through open-ended responses one by one.
Qualaroo’s AI Sentiment Analysis handles it automatically. Every free-text response is tagged as positive, neutral, or negative, and recurring themes are surfaced across the full cohort so your team sees the pattern, not the pile.
Here’s how:
When you spot a pattern, the action becomes clear: if 35% of churned users cite “didn’t understand how to use [feature],” that is an onboarding problem with a specific solution.
If 25% cite “found a cheaper alternative,” that is a pricing or value communication problem.
Step 4: Build Smarter Cancellation Flows
The best exit survey is one that does more than collect data. It gives users a reason to reconsider before they finalize the cancellation.
Here is how a high-performing cancellation flow works:
- User clicks “Cancel” and a Nudge™ survey appears immediately
- They select their primary churn reason from a forced-choice list
- Based on their answer, the system presents a targeted offer:
- “Too expensive” receives an offer to downgrade or pause the account
- “Not using it enough” receives a link to a quick-start guide or a scheduled call with onboarding support
- “Missing features” receives a product roadmap update and an offer to join the beta
- If they still cancel, they complete the full exit survey
- High-value accounts are flagged for immediate CS follow-up
Pause acceptance rates during cancellation flows average 19% across subscription businesses, according to Churnkey’s State of Retention 2025 report.
That is nearly 1 in 5 churning customers who were retained simply because they were offered an alternative to canceling outright.
Step 5: Close the Loop With Churned Customers
Exit data becomes a re-engagement asset when you act on it.
If a cluster of churned users left because of a missing integration, and you ship that integration six months later, you have a legitimate reason to reach back out.
“You told us this was missing. We built it. Here’s how to pick up where you left off.”
Closing the loop, grounded in the specific reason they gave, converts far better than a generic win-back discount.
Every Customer Who Leaves Without Answering Is a Missed Fix
Most churn is preventable. Not all of it, but enough to matter.
The customers walking out right now are carrying the exact information your product team needs: what broke, what was missing, what a competitor offered that you didn’t.
Without an exit survey, that information disappears the moment they close the tab. With one, it becomes the clearest signal in your retention stack.
The difference between businesses that steadily improve retention and those that keep guessing is not the size of their CS team or the sophistication of their analytics.
It is whether they built a system to hear from the people who left.
An exit survey is that system. It is not a last-ditch save attempt. It is how you find the pattern that stops the next hundred customers from making the same decision.
You have the question framework, the timing table, the cancellation flow logic, and the step-by-step setup. The only thing left is putting it live before the next customer walks out.
Start with Qualaroo, and have your first exit survey live in under 15 minutes. No developer required.
Frequently Asked Questions
What is an exit survey?
An exit survey is a short questionnaire shown to customers who are canceling or leaving your product. It captures their reason for leaving, their satisfaction level, and what might have changed their decision. The goal is to turn that feedback into product improvements and retention strategies that stop future churn.
Why are exit surveys important for reducing churn?
Exit surveys surface the problems your satisfied customers will never tell you about. A 2014 Harvard Business Review study states that even a 5% increase in retention can increase profits by 25 to 95%, and that exit surveys combined with smart in-flow offers can cut voluntary churn. The feedback from churning customers also becomes your product roadmap's most honest input, revealing issues that internal reviews and happy-path analytics consistently miss.
How many questions should an exit survey have?
According to Zigpoll’s 2026 study, 1–3 questions is the optimal range. Lead with the churn reason question first so that if someone drops off early, you still capture the most important data point.
How does question branching make exit surveys more effective?
Question branching shows different follow-up questions based on what the customer answered previously. A user who selects "Too expensive" sees a pricing question next. A user who selects "Missing features" sees a question about which specific features they need. This keeps the survey short for each individual while producing more specific, usable data across the full cohort.
Should I use NPS in an exit survey?
Yes. NPS gives you a comparable metric to track alongside your ongoing customer satisfaction data. It also segments churned customers: high-scoring churners (7 to 10) are often returnable once specific issues are fixed, while low-scoring churners (0 to 4) signal a more fundamental mismatch between your product and their expectations.
How does auto-translation improve exit survey data quality?
If you have customers across multiple geographies, a customer who doesn't fully understand the question gives an unreliable answer. Qualaroo supports auto-translation into 70+ languages, detecting the user's browser language and automatically converting the survey. For global teams, this is the difference between consistent, usable exit data and noise from non-native speakers selecting the closest available option.
What should I do with exit survey data after I collect it?
Route responses to your CS or retention team in real time via CRM or Slack. Categorize reasons by frequency and account value to identify your highest-impact churn drivers. Review aggregated patterns monthly and update your product roadmap and onboarding flows accordingly. Use stated reasons to trigger personalized win-back outreach when the relevant issue has been resolved.
Can an exit survey help bring customers back?
Directly, yes, if you embed alternatives in the cancellation flow: pauses, plan downgrades, or onboarding calls offered based on the stated churn reason. According to a 2025 Chargebee study, 79% of consumers want the option to pause a subscription, and 58% have used a pause option rather than canceling in the past year. Indirectly, acting on exit data creates a legitimate reason to reach back out to churned users once the issue they flagged has been fixed.
FREE. All Features. FOREVER!
Try our Forever FREE account with all premium features!
 We'd love your feedback!
What did you like & how can we make it even better?
 Thanks for your feedback!
 Ask Your Question
Have a question? Get expert help to make your decision easier.
