

I have run surveys that collected hundreds of responses and still left me with no clear answer about what to build next. The problem was never the sample size. It was the questions.
Most market research surveys gather plenty of data and produce very little clarity. The issue is not how many questions you ask. It is asking the wrong ones, in the wrong order, worded in a way that quietly steers people toward telling you what you want to hear.
This guide gives you:
- Organized question sets by goal, you can copy today
- A simple framework for writing questions that do not lead respondents
- Benchmarks for what good results actually look like
Teams that deploy surveys through tools like Qualaroo capture users in the moment, right after a key action, before recall bias sets in.
That timing detail matters more than most people realize. We will get to it.
What Market Research Questions Should You Ask for Each Goal?
The right questions depend entirely on what decision you are trying to make. Below are question sets organized by the six most common research goals. Each set is ready to copy, adapt, and deploy.
Qualaroo lets you deploy any of these question sets as in-context Nudge surveys, triggered by specific user behavior, so the question appears at the exact moment the experience is fresh.
What Questions Help You Find New Product Opportunities?
These questions work because they surface unmet needs before you build anything. The key is staying in past-behavior territory. “Would you use a product that does X?” is almost always the wrong question. “What did you do the last time X happened?” is the right one.
That principle comes from Rob Fitzpatrick’s Mom Test: never ask people if they like your idea, because they will be polite. Ask about real past experiences instead.
Here is a set built around that logic:
| Question | What It Measures | Why It Works |
|---|---|---|
| What is the hardest part of [task] for you right now? | Top-of-mind pain intensity | Gets to the most pressing problem without leading |
| What have you already tried to solve it? What did not work? | Solution awareness and frustration depth | Reveals gaps in existing options |
| If you could change one thing about how you currently [do X], what would it be? | Latent product wish | Forces specificity instead of a generic wish list |
| What tools or workarounds do you use today that you wish you did not need? | Manual effort and cobbled solutions | Pinpoints where customers are already spending time and money |
| Walk me through the last time you faced this problem. | Behavioral context and frequency | Behavioral framing gets honest, detailed answers |
| How much time do you spend on [task] in a typical week? | Problem severity and opportunity size | Quantifies the cost of the problem |
| What would have to be true for this problem to go away on its own? | Root cause awareness | Surfaces whether the problem is structural or situational |
| Who else in your team or organization deals with this same issue? | Buying unit size and influence map | Indicates whether this is a personal or organizational purchase |
| What have you given up trying to fix because it felt too hard? | Abandonment and resignation signals | Identifies problems that customers have stopped believing are solvable |
| If you had a magic wand, what would the ideal version of [process] look like? | Ideal state and unanchored desire | Removes practical constraints to reveal true needs |
| What is the one thing you wish existed in this space that does not yet? | White space in the market | Finds gaps that competitors have not addressed |
| How do you currently measure whether [task] is going well? | Success metrics customers already use | Tells you how they will evaluate your product |
| What triggers you to go looking for a new solution? | Purchase trigger and timing | Reveals the moment of maximum intent |
The last three questions do the heavy lifting. They are behavioral, specific, and almost impossible to answer politely without giving you real information.
What Questions Measure Product-Market Fit?
One question does most of the work here. The Sean Ellis test asks: “How would you feel if you could no longer use this product?” with three response options: very disappointed, somewhat disappointed, or not disappointed.
If 40% or more of respondents answer “very disappointed,” you have a strong product-market fit signal. Below 40% means the product needs more work before you scale. This benchmark was validated across Superhuman, Slack, and dozens of early-stage B2B products.
The single question tells you your score. These three follow it up to tell you why:
| Question | What It Measures | Why It Works |
|---|---|---|
| How would you feel if you could no longer use [product]? | Core PMF signal | The Sean Ellis benchmark: 40% or more "very disappointed" indicates real traction |
| What would you use instead if this product went away? | Competitive substitutes | Reveals who your real competition is, not who you think it is |
| What is the main benefit you get from this product? | Perceived core value | Often different from what you built it to do |
| What type of person do you think would benefit most from it? | Ideal customer profile from the user's lens | Customers describe your best-fit segment better than you can |
| How long did it take before you started getting real value from it? | Time-to-value and onboarding friction | Long ramp times are a retention risk signal |
| What almost made you stop using it in the first few weeks? | Early churn triggers | Surfaces drop-off moments your activation data may miss |
| How has your usage changed since you first signed up? | Engagement trajectory | Increasing usage signals a deeper fit, while a decline is an early warning |
| Which feature would you miss most if we removed it? | Core value driver | Tells you what not to cut and what to double down on |
| What does this product help you accomplish that nothing else could? | Unique value proposition in customer language | Produces strong, authentic positioning insights |
| If you were recommending this to a colleague, how would you describe it? | Word-of-mouth framing | Reveals how the product actually spreads |
One Thing to Watch: Running a PMF survey requires catching the right users at the right moment, not blasting your whole list. Qualaroo’s targeting lets you show this survey only to users who have completed a meaningful action at least once, which keeps the signal clean.
If you are below 40%, do not panic. Use the follow-up question responses to identify which user segment is closest to the threshold, then double down on serving that group before widening the funnel.
Here’s a Product-Market Fit template you can use:
What Questions Uncover Customer Needs and Buying Motivations?
People will tell you what they want. Getting them to tell you why they want it takes different questions.
There is a consistent gap between stated needs (what people say they want) and latent needs (what their behavior actually reveals).
These questions close that gap:
| Question | What It Measures | Why It Works |
|---|---|---|
| What were you hoping to accomplish when you first signed up? | Original intent vs. current reality | Surfaces expectation gaps before they become churn |
| What almost stopped you from buying? | Pre-purchase objections | Reveals the friction your sales page is not addressing |
| How are you currently solving this problem? | Status quo awareness | Shows what you are actually competing with |
| What would make you a loyal customer long-term? | Retention drivers | Customers tell you what to build for stickiness |
| If a friend asked why they should try this, what would you tell them? | Word-of-mouth language | Gives you your customers' actual pitch |
| What does success look like to you after 90 days of using this? | Success definition | Helps align onboarding to their expectations |
| What problem were you trying to solve when you first found us? | Acquisition intent | Identifies which pain point drives discovery |
| How important is this problem to your day-to-day work, on a scale of 1 to 10? | Problem priority and urgency | Quantifies how much they care before explanation |
| What would you lose if this problem were never solved? | Stakes and cost of inaction | High-stakes answers signal willingness to pay |
| What made you decide to look for a solution now, rather than six months ago? | Trigger event | Pinpoints the moment of maximum intent |
| Have you tried solving this with a free tool or workaround? What happened? | DIY behavior and solution ceiling | Shows effort and budget already invested |
| What does your decision-making process look like when evaluating something like this? | Buying process complexity | Reveals sales cycle length and stakeholders |
| Who else is affected by this problem in your organization? | Organizational reach | Helps identify expansion opportunities |
| What would have to change for this to become your top priority? | Conversion barrier | Surfaces the unlock condition for hesitant buyers |
| How do you define "good enough" when it comes to solving this? | Minimum acceptable solution bar | Clarifies required vs. desired quality level |
The second and fifth questions are the most underused. “What almost stopped you?” surfaces the real objections your sales page probably is not addressing. “What would you tell a friend?” gives you the exact language your best customers already use to describe the value you provide.
Here’s a Buying Motivations template you can use:
What Competitive Analysis Questions Reveal Market Positioning?
Competitive questions work best when they focus on behavior and category rather than specific brand names.
Asking “how do we compare to [competitor name]?” primes the respondent and reduces the reliability of the answer. Category framing gets cleaner data.
| Question | What It Measures | Why It Works |
|---|---|---|
| Which other options did you consider before choosing us? | Actual consideration set | Reveals your true competitive landscape from the buyer's perspective |
| What made you choose us over those alternatives? | Primary differentiator | Your real selling point, in customer language |
| What does a competitor in this space do better than we do? | Competitive weakness | Honest gap analysis without relying on internal assumptions |
| If we disappeared tomorrow, what would you use instead? | Substitution behavior | Forces a real answer instead of a hypothetical preference |
| What is one feature you wish we had that you have seen elsewhere? | Feature gaps vs. competition | Direct product roadmap input grounded in comparison |
| How did you first hear about us? | Acquisition channel effectiveness | Tells you where your best customers actually come from |
| What were your top criteria when evaluating options in this category? | Purchase decision drivers | Shows what to lead with in positioning and sales |
| Have you switched from another tool to get here? What drove that decision? | Switching triggers | Reveals the tipping point that drives competitor churn |
| What would make you consider switching away from us in the future? | Retention vulnerability | Identifies risks before they become cancellations |
| How do you think about us compared to doing this manually or in-house? | Build vs. buy framing | Clarifies whether your real competitor is a tool or a workaround |
| What do you wish more tools in this space understood about your needs? | Category-level frustration | Surfaces unmet needs across the market |
| If you were building a shortlist today, what criteria would make the cut? | Evaluation framework | Reveals how buyers define the category standard |
The fourth question is particularly useful because it forces respondents to think about actual alternatives rather than theoretical ones. The answers will tell you more about your real competitive position than any analyst report.
Here’s a Competitive Analysis template for you:
What Buyer Behavior Questions Improve Customer Segmentation?
Demographics tell you who your customers are. Psychographics tell you why they buy. For most product and positioning decisions, the why matters more.
These questions surface decision-making style, learning preferences, and motivations that demographic fields cannot capture:
| Question | What It Measures | Why It Works |
|---|---|---|
| When evaluating a new tool, what matters most: speed, cost, reliability, or support? | Decision-making priorities | Tells you how to lead your pitch for each segment |
| How do you prefer to learn something new: video, written guide, or trial and error? | Learning and onboarding preference | Shapes your activation and support strategy |
| How would you describe yourself as a buyer: research-heavy, gut-driven, or peer-influenced? | Purchase style | Helps you match sales and marketing tone to the buyer type |
| What does a good outcome look like for you six months from now? | Success framing | Aligns product messaging to how they measure value |
| What is your biggest professional priority right now? | Role context and timing | Tells you whether your product fits their current agenda |
| What usually prompts you to go looking for a new tool or solution? | Purchase trigger | Identifies the event-based moment to reach them |
| Who else is involved in decisions like this at your organization? | Buying committee structure | Reveals whether you are selling to a user or an evaluator |
| What keeps you coming back to a product after the first month? | Retention psychology | Surfaces habitual use drivers you can build into onboarding |
| How do you typically find out about new tools in your field? | Discovery channel preference | Tells you where to spend acquisition budget |
| Do you prefer to try before you buy, or research heavily before committing? | Risk tolerance | Shapes whether free trial or case study content converts better |
| How many people are typically involved when your team buys something like this? | Deal complexity | Indicates average sales cycle length and content needs |
| How often do you switch tools in this category? | Category switching behavior | Tells you how sticky or fluid this market is |
Demographics still matter for specific decisions like geographic rollouts or ad targeting. When you do need them, ask those questions at the end of the survey, not the start. Starting with age and income signals a generic survey and drives early drop-off.
Here’s a Psychographic template you can use:
What Questions Help You Set the Right Price?
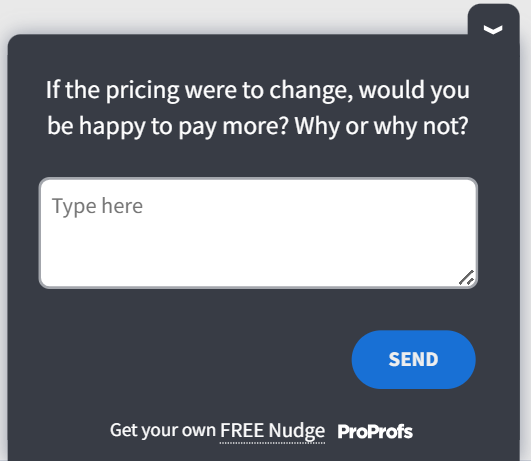
Do not ask “Would you pay X for this?” People say yes to hypothetical prices all the time and then do not convert when the real price appears.
The Van Westendorp Price Sensitivity Meter uses four questions instead:
| Question | What It Measures | Why It Works |
|---|---|---|
| At what price would this feel like a great value? | Lower bound of acceptable pricing | Anchors the floor where buyers feel they are getting a deal |
| At what price would it start to feel expensive but still worth it? | Upper bound of willingness to pay | Identifies the highest price before hesitation begins |
| At what price would it feel too expensive to consider? | Hard ceiling | Shows the point where you lose the segment entirely |
| At what price would you question whether it is good quality? | Lower quality threshold | Too cheap can signal poor quality, not just a bargain |
| How does our pricing compare to what you expected before you saw it? | Price perception vs. expectation | Reveals whether pricing creates a positive or negative surprise |
| Which pricing model fits your situation best: per user, flat monthly, or usage-based? | Pricing structure preference | Different segments prefer different pricing models |
| What would you need to see to justify a higher price point? | Value gap to close | Identifies features or proof points needed to increase price tolerance |
| Are there features you are paying for that you do not actually use? | Package efficiency | Signals a bloat or mismatch in the current pricing tiers |
| How does this compare in cost to the problem it is solving for you? | ROI framing | High perceived value suggests room to increase pricing |
| What would make a free trial more valuable before committing? | Trial-to-paid friction | Identifies barriers between free users and paid users |
Treat the results as directional. If 80% of respondents name a price well below your target, that is a signal worth investigating.
Validate with a real behavioral test, such as a landing page with an actual purchase button, before changing your pricing model.
Survey answers about pricing are honest intentions. Behavioral signals are actual decisions.
Here’s a Pricing template you can tweak and use:
What Questions Help You Reduce Churn and Improve Retention?
Retention research is some of the highest-leverage work you can do. Customers who are drifting toward the exit will tell you exactly why if you ask at the right moment.
The window is narrow. Ask too early, and they do not know yet. Ask too late, and they are already gone.
| Question | What It Measures | Why It Works |
|---|---|---|
| "What is the main reason you are thinking about canceling?" | Primary churn driver | The most direct and highest-value question you can ask a churning customer |
| "Was there a specific moment when you started using this less?" | Drop-off trigger event | Pinpoints the exact experience or absence of one that caused disengagement |
| "What would have to change for you to stay?" | Retention unlock condition | Tells you exactly what to fix, in priority order |
| "Did we ever solve the original problem you signed up to fix?" | Value delivery gap | If the answer is no, you have an onboarding or positioning problem |
| "What feature or improvement would make you an active user again?" | Re-engagement lever | Gives the product team a specific, actionable recovery path |
| "How did your expectations when you signed up compare to your actual experience?" | Expectation vs. reality gap | Surfaces overpromising in marketing or underdelivering in product |
| "Is there something we could have done differently in your first 30 days?" | Onboarding failure mode | Early experience shapes long-term retention more than any single feature |
| "What does the product you would switch to do better than us?" | Competitive churn reason | Tells you whether you are losing to a competitor or losing to inaction |
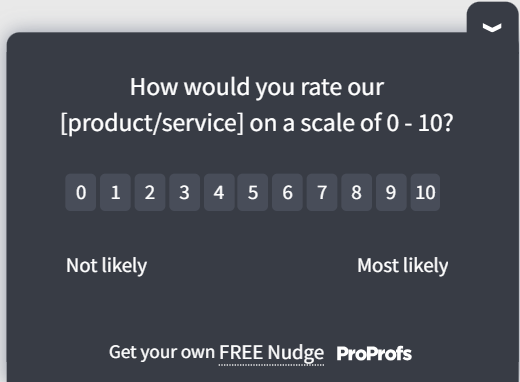
| "How likely are you to recommend us to someone else, on a scale of 0 to 10?" | NPS at risk | A low score from an active user is an early churn signal |
| "What would you tell our product team if you had five minutes with them?" | Unfiltered product feedback | An open invitation that often surfaces what no other question catches |
| "What part of the product do you find yourself returning to most often?" | Sticky feature identification | Even churning users have a hook; knowing it helps with win-back messaging |
| "What made you stay this long, even if you are considering leaving now?" | Retention anchor | Tells you what is working, so you do not accidentally remove it |
Here’s a Churn and Retention template you can use:
Question Bank by Industry
Most market research questions work across contexts. But the ones that convert best depend on what your buyers care about most, and that varies significantly by industry.
Below is a curated map of the highest-leverage questions from each set, filtered for six common buyer types. Use this as a quick-start filter before building your full survey.
SaaS / Software
Retention, activation, and expansion revenue are the core metrics. Focus on time-to-value and feature stickiness.
| Source Set | Question to Ask | Why It Fits |
|---|---|---|
| Product-Market Fit | How would you feel if you could no longer use [product]? | The Sean Ellis test is most widely validated in SaaS; 40%+ = scale signal |
| Churn & Retention | Was there a specific moment when you started using this less? | SaaS churn is event-driven: pinpointing the drop-off moment enables targeted re-engagement |
| Needs & Motivations | What does success look like to you after 90 days of using this? | Aligns onboarding flows to the outcomes that actually drive NRR expansion |
| Pricing Research | Which pricing model best fits your situation: per-user, flat monthly, or usage-based? | SaaS buyers have strong model preferences; getting this wrong kills conversion |
| Product Opportunities | What tools or workarounds do you use today that you wish you did not need? | Cobbled integrations = integration roadmap; internal scripts = feature gaps |
E-commerce / DTC
Purchase intent, abandonment friction, and post-purchase loyalty drive the metrics that matter.
| Source Set | Question to Ask | Why It Fits |
|---|---|---|
| Needs & Motivations | What almost stopped you from buying? | Cart abandonment is the #1 ecommerce leak: this surfaces the exact friction point |
| Competitive Analysis | Which other options did you consider before choosing us? | DTC shoppers evaluate 3–5 alternatives; knowing the real consideration set sharpens positioning |
| Buyer Segmentation | Do you prefer to try before you buy, or research heavily before committing? | Determines whether free returns, samples, or social proof convert best for this segment |
| Pricing Research | At what price would you question whether it is good quality? | DTC brands often underprice; the quality-floor question reveals room to move up |
| Churn & Retention | What part of the product do you find yourself returning to most often? | Identifies the hero SKU or experience that drives repeat purchase |
B2B / Enterprise
Long sales cycles, multi-stakeholder decisions, and ROI justification define B2B buying.
| Source Set | Question to Ask | Why It Fits |
|---|---|---|
| Needs & Motivations | What does your decision-making process look like when evaluating something like this? | Maps the buying committee and sales cycle length; critical for enterprise GTM |
| Needs & Motivations | Who else is affected by this problem in your organization? | Identifies economic buyer, champion, and blocker; the full influence map |
| Pricing Research | What would you need to see to justify a higher price point? | B2B buyers need ROI proof; this reveals exactly what case studies or data to produce |
| Competitive Analysis | Have you switched from another tool to get here? What drove that decision? | Enterprise switches are high-stakes; switching triggers = your best sales narrative |
| Product Opportunities | Who else in your team or organization deals with this same issue? | Surfaces, expansion seats, and cross-departmental use cases |
Healthcare / Wellness
Trust, compliance anxiety, and outcome measurement are the dominant purchase drivers.
| Source Set | Question to Ask | Why It Fits |
|---|---|---|
| Product Opportunities | What have you given up trying to fix because it felt too hard? | Regulatory friction causes resignation, which surfaces the unsolved problems worth tackling |
| Needs & Motivations | What would you lose if this problem were never solved? | Stakes framing works powerfully in healthcare, where the cost of inaction is concrete |
| Competitive Analysis | How do you think about us compared to doing this manually or in-house? | Many healthcare orgs still use manual workflows; the build-vs-buy question clarifies real competition |
| Buyer Segmentation | Who else is involved in decisions like this at your organization? | Procurement, compliance, and clinical leads all influence healthcare buying |
| Churn & Retention | Did we ever solve the original problem you signed up to fix? | Outcome gap is the top churn driver in healthcare software |
Fintech / Financial Services
Trust signals, regulatory clarity, and switching costs dominate the decision process.
| Source Set | Question to Ask | Why It Fits |
|---|---|---|
| Needs & Motivations | What almost stopped you from buying? | Fintech objections cluster around security, compliance, and integration: this surfaces all three |
| Pricing Research | How does this compare in cost to the problem it is solving for you? | ROI framing resonates strongly when the "problem cost" is a real dollar figure |
| Competitive Analysis | What would make you consider switching away from us in the future? | High switching costs mean retention vulnerabilities are slow-burning; surface them early |
| Product-Market Fit | What does this product help you accomplish that nothing else could? | Unique value is everything in a heavily regulated, feature-parity market |
| Buyer Segmentation | How would you describe yourself as a buyer: research-heavy, gut-driven, or peer-influenced? | Fintech buyers skew heavily research-first; confirm content marketing over paid ads |
Agencies / Services
Client fit, scope clarity, and repeatability of delivery define agency growth.
| Source Set | Question to Ask | Why It Fits |
|---|---|---|
| Product Opportunities | What is the one thing you wish existed in this space that does not yet? | Agency clients have highly specific unmet needs; white space = new service line |
| Churn & Retention | How did your expectations when you signed up compare to your actual experience? | Expectation gaps are the leading cause of agency churn, and scope creep starts here |
| Competitive Analysis | What were your top criteria when evaluating options in this category? | Reveals whether clients buy on price, specialization, speed, or reputation |
| Needs & Motivations | If a friend asked why they should try this, what would you tell them? | Referral language is the agency's most powerful sales asset |
| Buyer Segmentation | What usually prompts you to go looking for a new tool or solution? | Trigger events (lost pitch, new hire, tech failure) are the right moment to reach agency buyers |
Download this Market Research Question Bank:
How Do You Write Customer Research Survey Questions That Avoid Bias?
Most survey bias is unintentional. It sneaks in through word choice, question structure, and time references that seem harmless.
A leading question steers the respondent toward a preferred answer, either through evaluative language, a loaded premise, or a limited set of answer choices. The result is data that confirms your assumptions rather than tests them.
Here is a five-step process for writing clean questions:
- Draft in Plain Language: Aim for a Grade 6 reading level. If you would not say it in a conversation, rewrite it.
- Remove Evaluative Words From the Question Stem: Words like “great,” “easy,” “excellent,” or “helpful” belong in answer choices if needed, not in the question itself.
- Split Double-Barreled Questions: If your question contains “and,” it is probably two questions. “How satisfied are you with the price and quality?” cannot be answered honestly as a single response.
- Anchor the Time Frame: Replace “recently” or “sometimes” with specific windows. “In the past 30 days” is measurable. “Recently” is not. Vague time references introduce recall bias that makes responses unreliable.
- Pilot With Five People: Ask them what they thought the question was asking. If two out of five interpret it differently than you intended, rewrite before sending.
Expert Perspective: A 2021 HBR research indicates that the biggest source of bad data is not sample size or platform choice. It is question wording.
Furthermore, Stanford psychologist Jon Krosnick has spent decades studying why survey responses go wrong. His research on satisficing (the tendency for respondents to give “good enough” answers rather than accurate ones when questions feel cognitively demanding) explains the mechanism behind most bad survey data.
Read the question and ask whether a skeptical respondent could reasonably interpret it in a way that biases toward a specific answer. If yes, rewrite it.
What Do Good Market Research Survey Results Actually Look Like?
Before you analyze anything, it helps to know whether your data collection worked. These benchmarks tell you whether your response rate and sample size are in a reliable range.
| Metric | Typical Range | What to Do if You Are Below It |
|---|---|---|
| In-product survey response rate | 20% to 30% | Check timing. Surveys show mid-session underperform post-action surveys by 2x. |
| Email survey response rate (own list) | 15% to 25% | Shorten the survey. Each question beyond 7 drops completion by 10 to 15%. |
| Cold outreach response rate | 1% to 5% | Add personalization or a small incentive. Generic blasts rarely break 2%. |
| Minimum responses for pattern detection | 100 to 200 | Below this, findings are directional only, not reliable for decisions. |
| Ideal survey length | 5 to 7 questions | Beyond this, the quality of later answers declines even if completion holds. |
| PMF threshold (Sean Ellis) | 40% "very disappointed" | Below 40%: identify your closest segment and focus product effort there first. |
Timing is the single biggest lever for in-product response rates, and most teams get it wrong. Surveys that appear mid-session, or worse, immediately on page load, consistently underperform.
Qualaroo’s behavioral targeting lets you trigger surveys based on specific user actions, session depth, or page context, which is why in-product timing is far easier to control than most teams assume.
FREE. All Features. FOREVER!
Try our Forever FREE account with all premium features!
How Do You Make Sense of Survey Responses Without Getting Lost in the Data?
Collecting responses is the easy part. Turning them into a decision is where most research efforts stall. Here is a five-step process that keeps analysis moving without losing nuance:
- Read Before You Code: Go through the first 20 to 30 open-ended responses before assigning any categories. Let the themes emerge from the data, not from your assumptions going in.
- Quantify the Themes: Once you have 5 to 7 recurring themes, count how often each appears. This turns qualitative data into a frequency you can share with stakeholders in a single slide.
- Segment by User Type: Split responses by new versus returning, high versus low spend, or churned versus active. The same question often produces very different answers across groups, and the segment-level differences are usually where the real insight lives.
- Map Each Insight to a Decision: For every major finding, write one sentence: “This means we should…” If you cannot write that sentence, the finding is interesting but not actionable.
- Validate Outliers Before Acting: If a finding surprises you, run a short follow-up to 20 to 30 users before changing anything. One targeted survey beats three rounds of internal debate.
Manually reading and categorizing 200 or more open-ended responses is slow and introduces the researcher’s own bias into the categorization.
Qualaroo’s AI sentiment analysis automates that step, so you spend time on decisions rather than spreadsheets.
How Did Twilio Use Market Research Questions to Ship Faster?
Twilio, a cloud communications platform, placed customer research at the center of its product development process rather than treating it as a one-time validation exercise.
The constraint was real: abundant product ideas, limited time, and budget to test them all. The team could not afford to build on assumptions.
So they deployed targeted market research surveys to specific user segments, asking two core types of questions: what challenges are you dealing with right now, and what problems do you expect to face in the next six months.
The survey data served as a prioritization filter. Ideas that aligned with high-frequency, high-intensity problems moved to the front. The result was a weekly shipping cadence across 18 product teams, each grounded in validated priorities rather than internal opinion.
The principle is simple: research is not just a validation step at the end of a project. It is a recurring filter that keeps your team building things people actually need.
Teams running this kind of continuous research use Qualaroo to deploy targeted nudges to specific user segments without dev involvement, which removes the friction that typically kills research cadence in fast-moving teams.
Ready to Start Asking Better Questions?
Most teams do not have a research problem. They have a question-quality problem.
They send surveys, collect responses, and walk away with data that confirms whatever they already believed. Not because customers lied. Because the questions made it easy to say what felt polite rather than what was real.
The fix is not more questions. It is the right questions, asked at the right moment, worded in a way that gets out of your customers’ way and lets them tell you the truth.
Start with one goal. Pick one decision you need to make this week. Write five questions using the sets in this guide. Pilot them with five people before you send. Then ship it.
That is the whole system. The insight compounds from there. Deploy your first in-context survey in under 10 minutes, no developer needed (50 responses, 10k pageviews). Target it to users who just completed a key action.
The responses will tell you more in one week than a month of internal debate.
Frequently Asked Questions
What is the difference between open-ended and closed-ended market research questions?
Closed-ended questions give respondents fixed answer choices and produce data you can count: ratings, percentages, and frequencies. Open-ended questions accept free-text responses and produce language: reasons, stories, and frustrations. The most effective surveys use closed questions to measure and open-ended follow-ups to understand why.
How many questions should a market research survey have?
Five to seven questions is the sweet spot. Completion rates drop 10 to 15% for every question added beyond that. If you need more data, run two focused surveys to two different segments rather than one long survey to everyone.
What is the Sean Ellis test for product-market fit?
The Sean Ellis test uses a single question: "How would you feel if you could no longer use this product?" with three response options: very disappointed, somewhat disappointed, or not disappointed. If 40% or more answer "very disappointed," you have a strong product-market fit signal. Below 40% means the product needs refinement before you scale.
What is the Mom Test in market research?
The Mom Test is a principle from Rob Fitzpatrick's book of the same name. It says: never ask people if they like your idea because politeness distorts the answer. Instead, ask about past behavior. "When did you last deal with this problem?" is more reliable than "Would you use a product that solves it?"
How do you avoid bias in market research survey questions?
Remove evaluative language from the question stem, split any question containing the word "and" into two separate questions, replace vague time references like "recently" with specific periods like "in the past 30 days," and pilot-test with five people before sending. If two out of five interpret it differently than intended, rewrite it.
Should you ask demographic questions in a market research survey?
Only when the demographic data directly changes a specific decision, such as geographic rollout or ad targeting. Ask demographic questions at the end of the survey, not the start, to avoid early drop-off. For most product decisions, behavioral and psychographic questions produce more actionable data than age or income alone.
How do you measure willingness to pay without asking "Would you pay X?"
Use the Van Westendorp Price Sensitivity Meter: ask four questions about the price points where the product feels like a great deal, expensive but worth it, too expensive, and too cheap to trust. Treat the results as directional and validate with a real behavioral test, such as a landing page with an actual purchase button, before locking in pricing.
FREE. All Features. FOREVER!
Try our Forever FREE account with all premium features!
 We'd love your feedback!
What did you like & how can we make it even better?
 Thanks for your feedback!
 Ask Your Question
Have a question? Get expert help to make your decision easier.