
You’ve sent surveys before. Some returned useful data. Most didn’t. The questions felt right, the responses came in, and then nothing happened, because the data was either too vague to act on or nobody trusted it enough to make a decision based on it.
That’s the real problem product managers, CRO teams, and customer success leads run into.
It’s not a question-writing problem. It’s a methodology problem: wrong audience, wrong timing, no skip logic, no target sample size, and no plan for what happens after the responses land.
Tools like Qualaroo are built on the premise that context fixes this.
Ask the right person, in the right moment, inside the actual product or page they’re using, and you get feedback worth 10x more than a link dropped in an email three days later.
But the tool only works if its methodology is solid. This guide gives you that methodology, end to end.
What Is a Survey and Why Does the Methodology Matter?
A survey is a structured set of questions designed to collect consistent, comparable data from a defined group of people. It works by presenting the same stimuli (questions, scales, response options) to multiple respondents so you can identify patterns, measure sentiment, and make decisions backed by evidence rather than assumption.
For product and growth teams, surveys are the fastest way to get a first-party signal directly from the people using your product.
They tell you why users churn, which feature to build next, what’s breaking the checkout flow, and whether your support experience is actually as good as your team thinks it is.
The methodology matters because surveys are easy to get wrong without knowing it.
You can design a survey that collects hundreds of responses and still walk away with nothing actionable, because the questions were leading, the audience was wrong, or the timing meant respondents were guessing instead of reporting actual experience.
The seven steps below fix that. They’re written for people running surveys inside SaaS products, e-commerce sites, and B2B platforms, not for academic researchers.
The goal is data you can act on before the next sprint ends.
How to Conduct a Survey: Step-by-Step Breakdown
Here are the steps to conduct a survey effectively. Each step depends on the one before it. Skipping any one of them affects the quality of your results.
Step 1: Define Your Research Objective
Write one sentence before you open any survey tool. Complete this prompt: “This survey will tell us ______ so we can ______.”
If you can’t finish that sentence cleanly, stop. You don’t have a research objective.
You have a hunch and a blank form, which is exactly how you end up with fifteen questions covering five topics, producing data that could justify any decision you were already going to make.
Product teams fall into this trap constantly. Someone says, “let’s survey the new onboarding flow,” and two days later, there’s a Nudge with nine questions spanning satisfaction, feature requests, support quality, and pricing.
The responses come in, and nobody knows what to do with them.
Good research objectives are specific enough to drive a decision:
- “This survey will tell us why users abandon the checkout page so we can fix the top friction point before Q3 launch.”
- “This survey will tell us which of three proposed features Business plan users want most, so we can lock the roadmap this sprint.”
- “This survey will tell us our NPS among users active for 90+ days so we can set a baseline before the redesign ships.”
One objective. One decision. One survey. If you have three objectives, run three surveys.
Step 2: Identify Your Target Audience
Audience selection is where most survey programs fail before a single question is written.
The relevance of your respondent to the research objective determines whether you collect signal or noise. First-time visitors can’t tell you about repeat purchase behavior.
Users who haven’t touched a feature can’t evaluate it. Prospects who never converted can speak to the sales experience, not product quality.
The more precisely you define your audience before launch, the less cleanup you do after.
Here’s a targeting framework built around the decisions product and CRO teams actually make:
| Research Objective | Right Audience | Wrong Audience |
| Checkout Abandonment | Visitors who reached payment but didn’t complete | All site visitors |
| Feature Satisfaction | Users who triggered that feature at least once | All registered users |
| NPS Baseline | Users active for 60+ days | New signups under 7 days |
| Pricing Page Hesitation | Visitors who spent 45+ seconds on pricing | Homepage visitors |
| Post-Purchase CSAT | Customers within 48 hours of purchase | Prospects |
| Churn Risk | Users who haven’t logged in for 14+ days | Active daily users |
Narrow the audience using behavioral attributes: URL visited, time on page, scroll depth, actions completed or skipped, account age, plan type, and login frequency.
If your targeting isn’t precise enough to filter at the tool level, add a screening question as the first question in the survey.
Respondents who don’t qualify exit immediately without seeing irrelevant questions, and you don’t spend time filtering bad responses out of your dataset after collection.
Step 3: Design Your Survey Questions
This is where most survey guides start. It’s actually step three, because the questions you write depend entirely on the objective and audience you’ve already defined.
A few rules that hold regardless of survey type:
1. Start with the rating, end with the text box. Scaled and single-select questions go first. Open-ended questions go last. Respondents who complete structured questions are far more likely to write a useful free-text response than respondents who hit a blank field as their first interaction.
2. One thing per question. “How satisfied are you with our service and support?” is two questions in one. If a respondent loves the product but thinks support is slow, they can’t answer honestly. Split it.
3. Neutral framing only. “How much did the new dashboard improve your workflow?” presupposes it did. The version that produces honest data: “How has your workflow changed since we updated the dashboard?” Let the direction come from the respondent, not the question.
4. Consistent scales, every time. If your Likert scale runs 1 (Strongly Disagree) to 5 (Strongly Agree) in one question, don’t reverse it in the next. Inconsistent anchoring is one of the most common causes of unreliable data in recurring surveys, and it rarely gets caught until someone tries to compare results across waves.
5. Ground questions in memory, not imagination. “What would you pay for this feature?” is a hypothetical. People answer poorly. “What do you currently pay for tools that do something similar?” is a memory question. People answer accurately. Ask about what respondents have done or currently experience, not what they predict they’d do.
Step 4: Add Skip Logic
Defining your questions doesn’t solve the problem that half your audience shouldn’t see half your questions.
Skip logic routes each respondent through a different path based on their previous answers.
It keeps the survey shorter for each person and ensures every question they see is relevant to their actual experience.
Here’s how it works in practice:
You’re running a satisfaction survey for a product that has both a mobile app and a web platform:
Q1: Which version do you use most often?
- Mobile app (iOS or Android)
- Web browser
Mobile users route to questions about the app: load time, offline behavior, notification preferences. Web users route to questions about the browser: page speed, layout, keyboard navigation. Neither group sees questions that don’t apply to them.
The result: shorter surveys, cleaner data, and respondents who feel like the survey was built for them, not for everyone and no one simultaneously.
Before you activate, trace every branch manually. A broken skip doesn’t announce itself. It quietly stops collecting responses from that segment, and you find out weeks later when the data skews toward one group with no explanation.
Step 5: Set Your Deployment Triggers
Timing is probably the single biggest driver of data quality that teams underweight.
The difference between asking “How was your checkout experience?” two days after purchase versus showing that question on the order confirmation page is the difference between a respondent reconstructing a memory and a respondent reporting what just happened.
One produces reliable data. The other produces a rationalization.
A post-support survey sent 24 hours after the interaction captures specific, clear feedback about what happened.
The same survey sent 7 days later captures whatever the customer still remembers, filtered through how their mood has shifted since.
Use this trigger guide directly:
| Survey Goal | Trigger | Channel |
| Post-Purchase CSAT | Order confirmation page loads | In-product or website |
| Feature Satisfaction | User completes the feature workflow | In-product Nudge |
| Exit Intent | Cursor moves toward browser bar | Exit intent popup |
| NPS (90-Day Cohort) | Account reaches 90 days of activity | In-app or email |
| Pricing Page Hesitation | 45+ seconds spent on pricing page | Website Nudge |
| Onboarding Completion | User completes first core action | In-product |
| Churn Signal | User hasn’t logged in for 14+ days | |
| Post-Cancellation | User confirms downgrade or cancellation | Post-cancel page |
Step 6: Collect a Statistically Reliable Sample
Two things determine whether your results are statistically reliable: sample size and response rate.
Sample size is how many completed responses you need before results are accurate at a defined confidence level.
According to Makeable Consulting’s calculations, for most product and CRO surveys, 95% confidence with a 5% margin of error is the right target. For an audience of 10,000 users, that means 370 completed responses.
For 1,000 users, you need about 278. Set this number before you launch. It tells you whether your targeting window is wide enough to hit it.
Response rate is what determines whether you actually reach that number. 2025 Clootrack benchmarks by channel:
- Email surveys: 15–25% (highly variable based on list quality, personalization, and send timing)
- In-app and website modal surveys: 20–30%
- SMS surveys: 40–60% for short, transactional formats (typically 40–50%)
If your target is 300 responses and your expected rate is 15%, you need at least 2,000 eligible respondents in the targeting window.
Three things that reliably move response rates up:
Add an incentive relevant to the respondent. A discount code on a CSAT survey, a summary of results for an NPS survey, or a personalized recommendation tied to answers.
Incentivized surveys get more responses than non-incentivized surveys. Gallup’s 2025 experiment showed a $1 prepaid incentive increased response rates from 11.8% to 26.3% (a 123% relative increase, far exceeding the typical 10–15% range in many contexts).
Send one reminder. According to Clootrack’s 2025 guide for insights, a single follow-up lifts response rates by up to 30%.
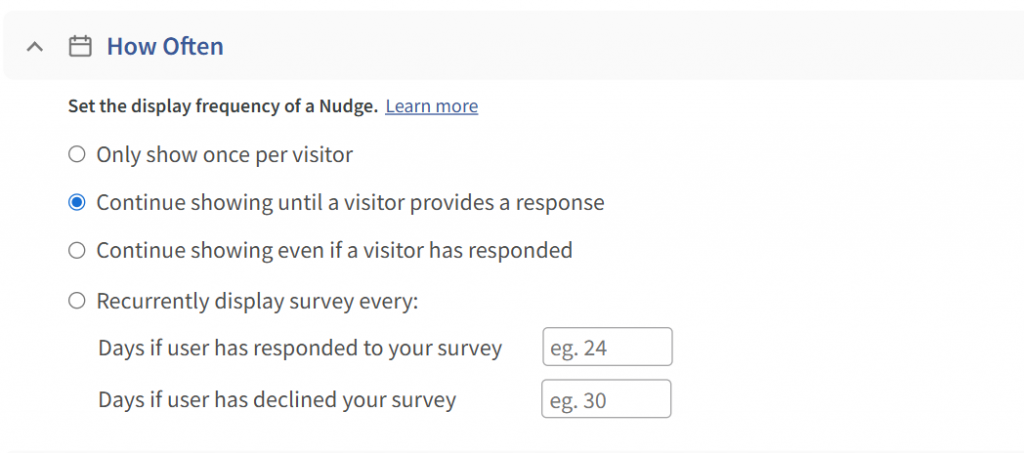
For in-app surveys, set the Nudge to reappear on the respondent’s next visit if they dismissed it without responding.
State the purpose upfront. One sentence explaining why you’re asking and what you’ll do with the answers. “Your feedback directly shapes our Q3 roadmap” outperforms “Please take a moment to complete this survey” every time.
Step 7: Analyze Results and Act
Responses sitting in a dashboard are not insights. Insights are what happens after you’ve categorized the responses, identified the patterns, and routed the findings to someone who owns a decision.
Here’s an analysis workflow that runs without a data science team:
1. Categorize Before You Read for Patterns: Tag each response by type: bug report, feature request, UX friction, pricing objection, positive experience, support complaint. Categorizing first prevents confirmation bias from coloring your interpretation.
2. Quantify the Categories: What percentage of responses fall into each bucket? If 42% of NPS detractors mention checkout speed and 18% mention pricing, checkout speed is prioritized first.
3. Write a One-Line Action Summary Per Category: “UX friction: payment step requires too many fields. Possible fix: reduce to card, expiry, and CVV only. Owner: product. Priority: P1.” That’s a task, not an observation.
4. Mine Open-Ended Responses for Specifics: Free-text is where the most diagnostic feedback lives. It’s also hardest to process at scale. For anything over a hundred responses, reading every one individually doesn’t work. You need a way to surface themes and sentiment automatically.
5. Close the Loop: Tell respondents what changed because of their feedback. A changelog entry that says “we reduced checkout fields based on user feedback” closes the loop for every person who responded. Respondents who see their feedback lead to visible change are significantly more likely to respond to the next survey. That’s how you build a program, not a one-off.
Hootsuite ran exactly this cycle using Qualaroo. Targeted, in-context surveys followed by analysis and optimization produced a 16% lift in conversion at 98% statistical significance.

How to Build and Launch Your Survey in Qualaroo
Once you have your objective, audience, and questions defined, setting up in Qualaroo takes under an hour.
Qualaroo’s free plan covers up to 50 responses, which is enough to run your first survey and validate the full methodology before committing to a paid tier.
Step 1: Create a Nudge
In the Qualaroo dashboard, click “Create a Nudge.”
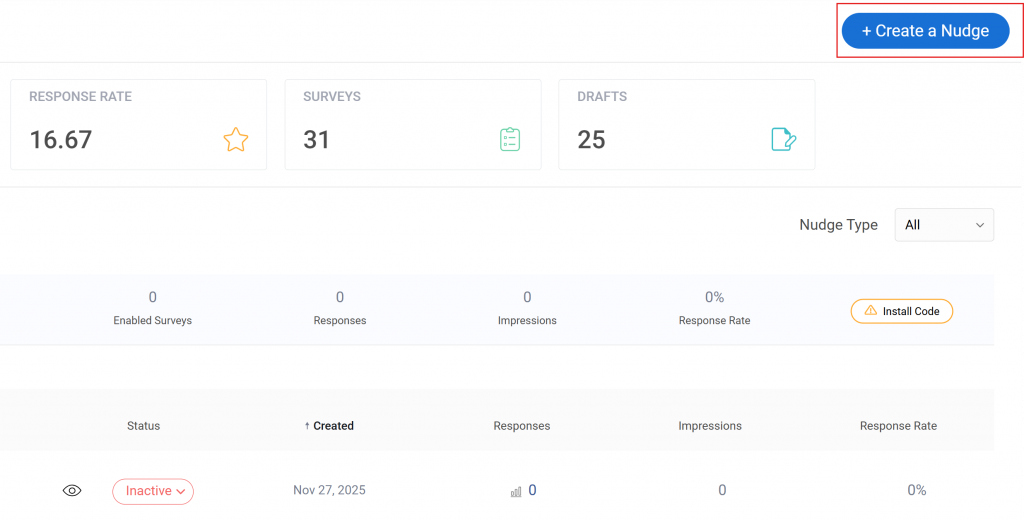
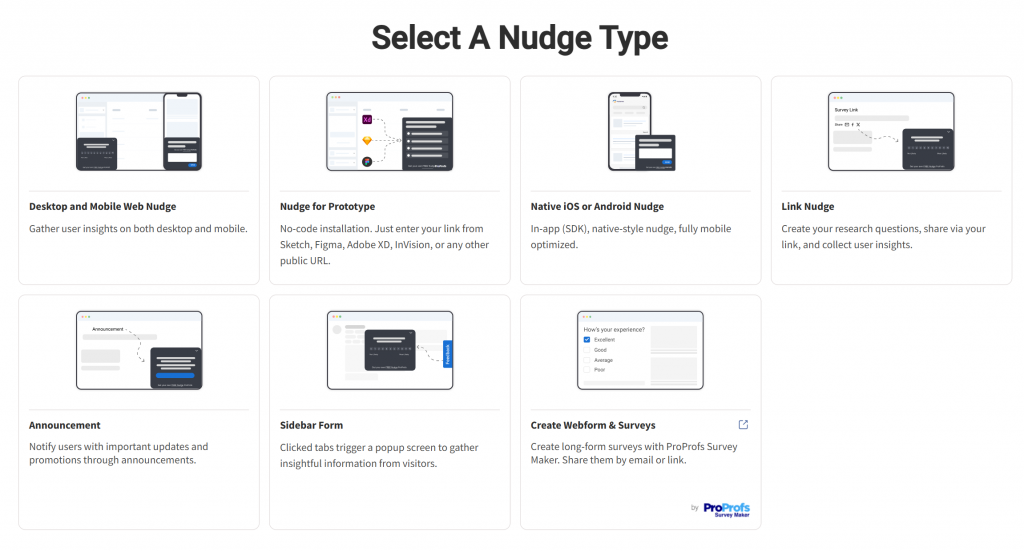
Choose the channel type, for example, desktop and mobile web nudge.
Step 2: Build Your Questions
Choose from 12+ question types: NPS, star rating, Likert scale, multiple choice, checkboxes, matrix, and free-text. Start from a pre-built template (NPS, CSAT surveys, exit-intent surveys, and feature feedback surveys) to get a validated structure, then edit inline.
Here’s the template library you can choose from:
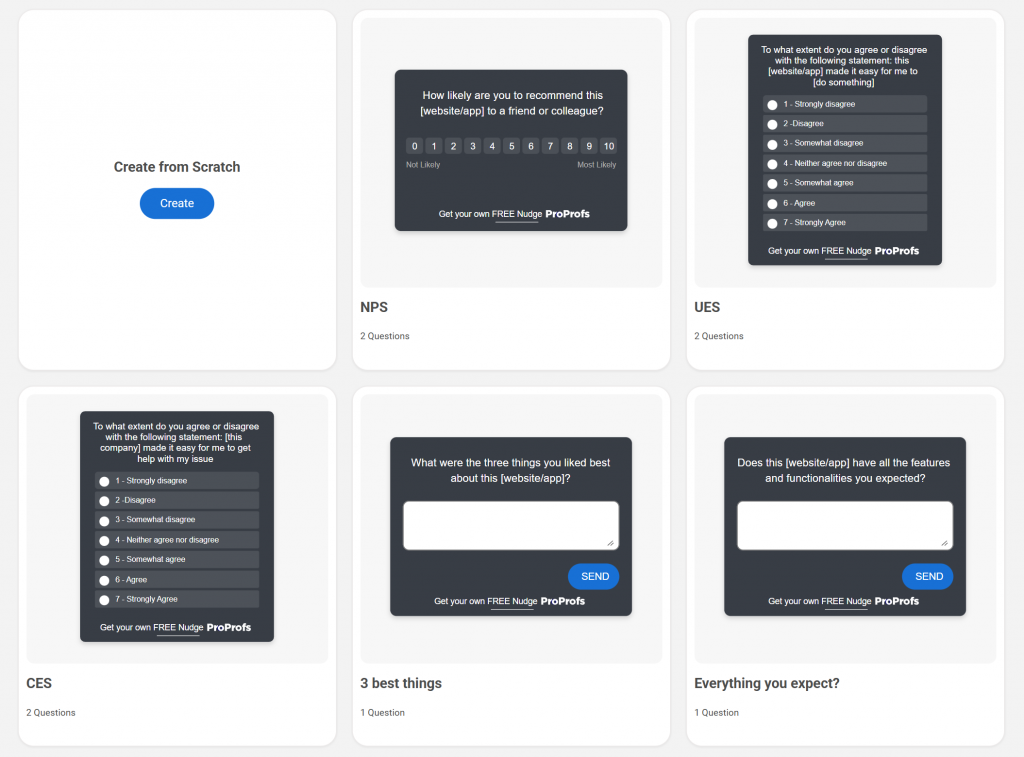
For global audiences, enable multilingual mode: Qualaroo supports 100+ languages and serves each respondent in their preferred language without requiring separate Nudges.
Step 3: Set-Up Skip Logic
Set conditions: “If the answer to Q1 is [option], jump to [question number].” Stack multiple conditions to cover every answer option.
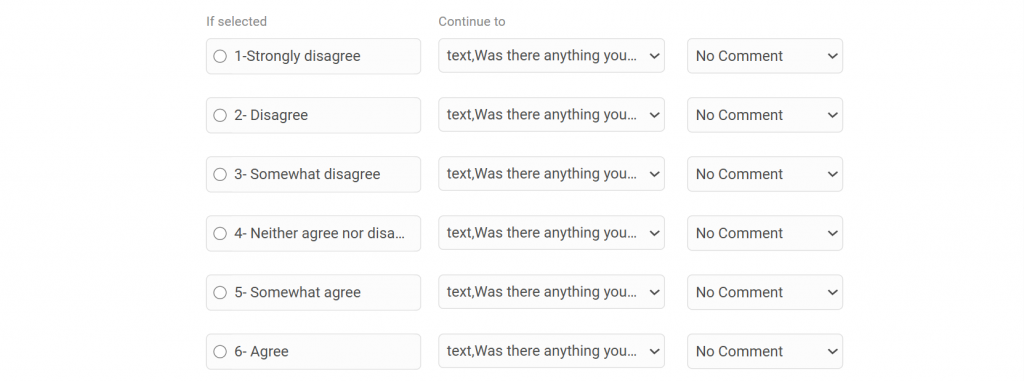
Qualaroo renders a visual branch map so you can trace each path before going live.
Use skip logic to end the survey immediately when a respondent selects a disqualifying answer, so those responses don’t enter your dataset.
Step 4: Configure Targeting and Triggers
In the Targeting panel, filter by URL (exact match, contains, or wildcard), visitor behavior (visit count, time on page, scroll depth), cookies, and custom variables passed from your app (plan type, account age, feature flag, user ID).
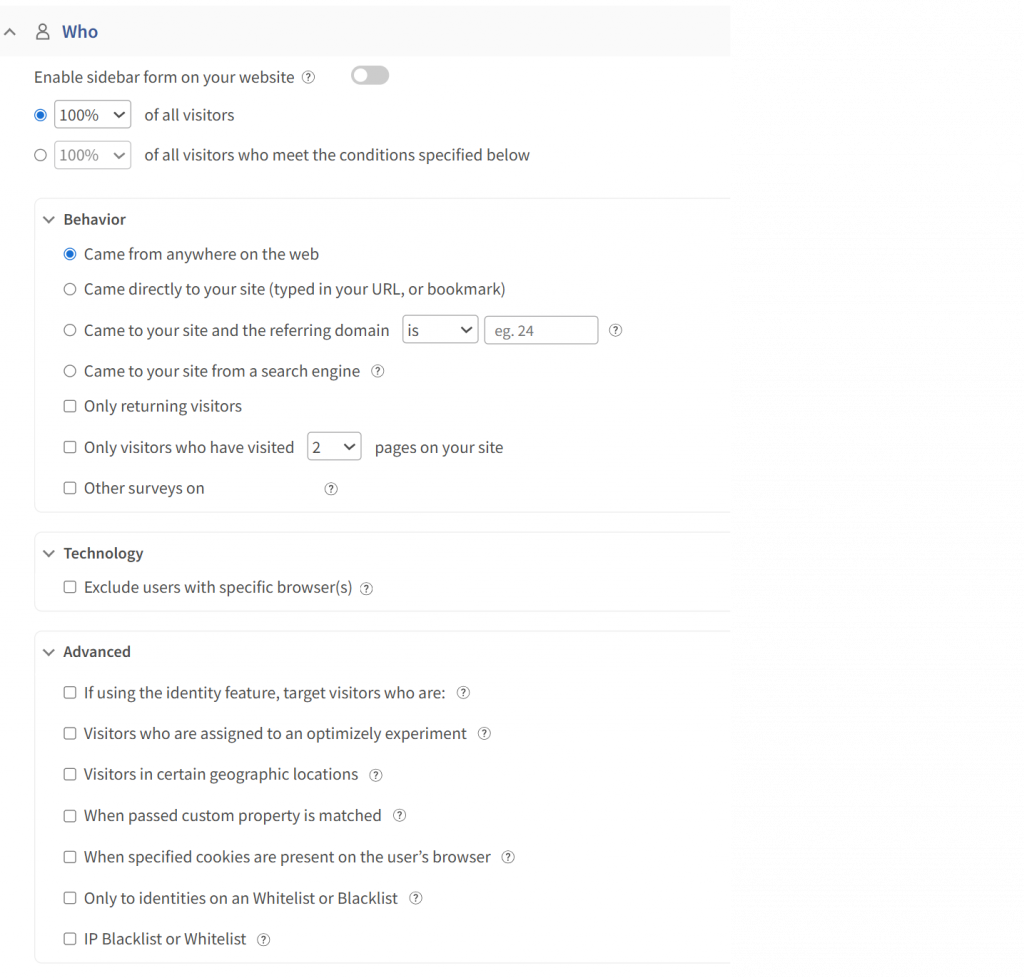
For logged-in users, add one line to your site: _kiq.push([“identify”, “user@email.com”]); and Qualaroo links every response to that user via the Identity API. You can then whitelist or blacklist specific users by email.
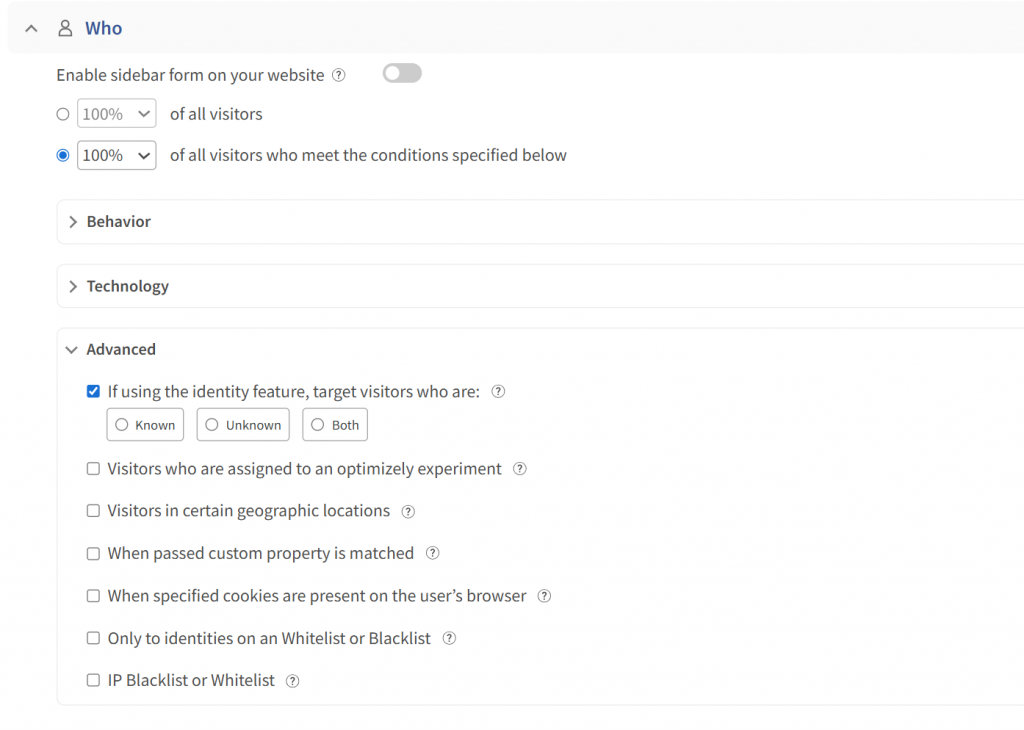
For triggers, combine time on page, exit intent detection, scroll percentage, visit count, or a custom JavaScript event fired when a workflow completes.
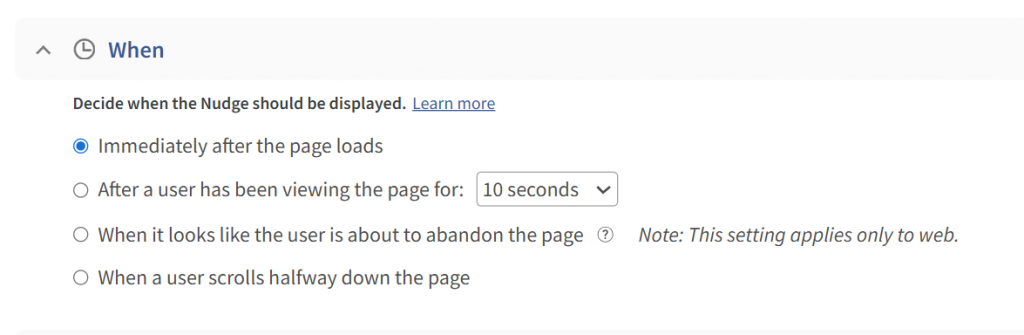
Stack conditions with AND/OR logic: show this Nudge only when the user is on /billing, has visited at least twice, hasn’t seen a Nudge in 30 days, and is tagged as a Business plan user.
Step 5: Analyze Responses
The Responses dashboard shows every answer in real time, filterable by date, question, and response value.
For NPS surveys, Qualaroo auto-segments respondents into Promoters, Passives, and Detractors and calculates your running score.
For open-ended responses, activate AI Sentiment Analysis powered by IBM Watson: it reads every free-text response, assigns a positive, neutral, or negative score, and generates a Word Cloud of the highest-frequency terms.
Here’s how you can use it:
Filter to negative sentiment first to triage critical feedback without reading hundreds of individual responses.
Export to CSV for deeper analysis, or connect to Salesforce or HubSpot via native integrations to route responses into your CRM as contact records, tasks, or deal notes automatically.
What Survey Questions Should You Use?
Here are a few ready-to-copy question sets by survey type, structured to follow the rules from Step 3: rating first, open-ended last, one thing per question, neutral framing throughout.
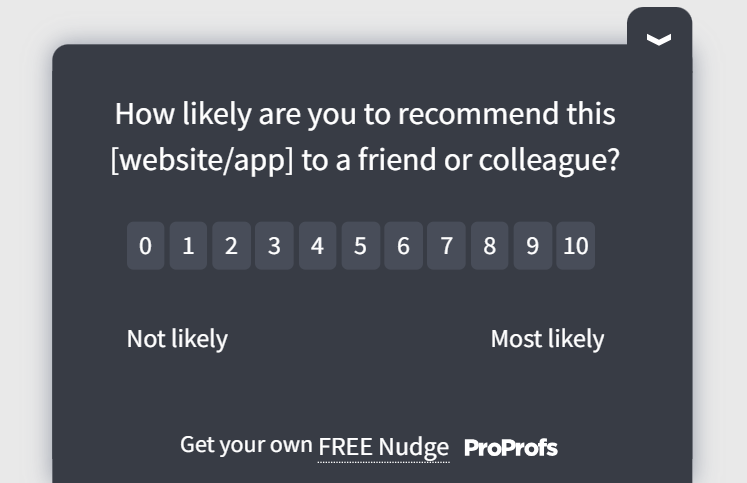
NPS Questions
- On a scale of 0 to 10, how likely are you to recommend [Product Name] to a colleague or friend?
Follow-Up for Detractors (0-6):
- What’s the main reason for your score? What would need to change?
Follow-Up for Promoters (9-10):
- What’s the one thing you’d tell someone who’s considering [Product Name]?
Here’s an NPS template you can use:
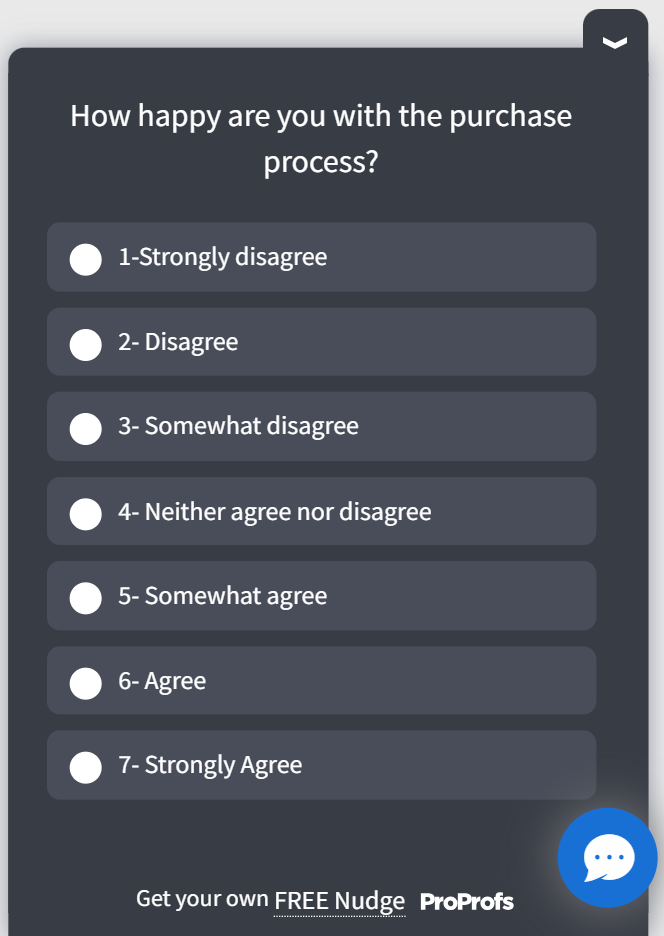
CSAT Questions
- How satisfied are you with your experience today? (Very satisfied / Satisfied / Neutral / Dissatisfied / Very dissatisfied)
- How would you rate [specific feature or interaction] on a scale of 1 to 5?
Follow-Up for Low Scores (1-3):
- What went wrong? What would have made this better?
Here’s a post-purchase CSAT survey template for you:
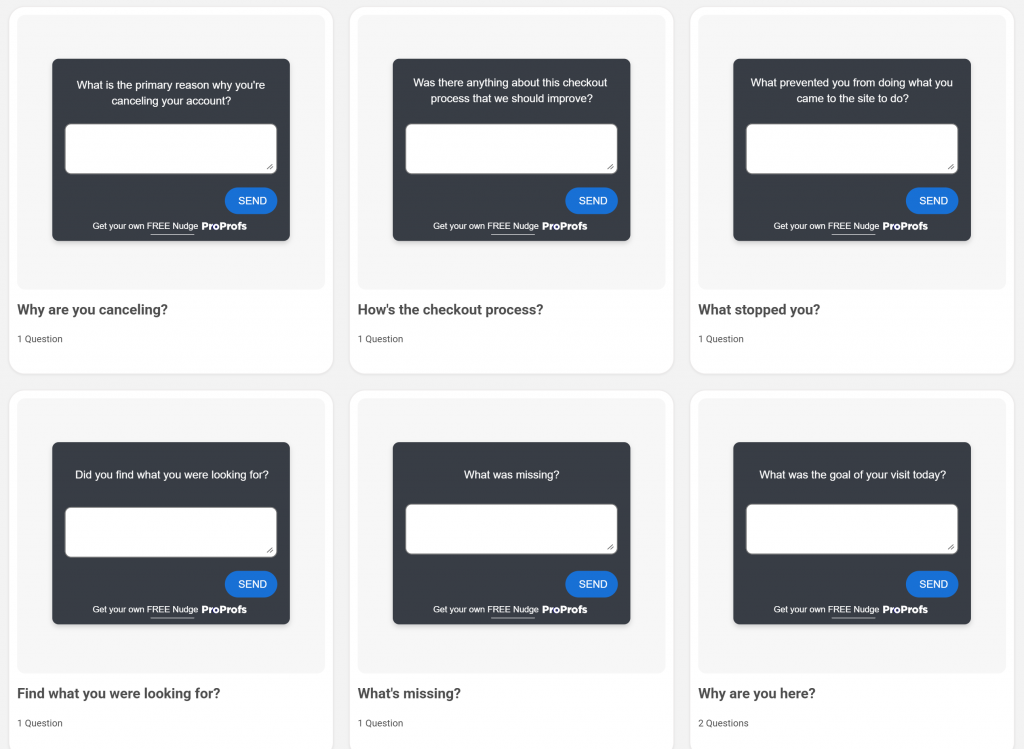
Exit Intent Questions
- What stopped you from completing your purchase today?
- Was there anything you were looking for that you couldn’t find?
- What would need to be different for you to come back?
Here are a few exit-intent survey templates for you:
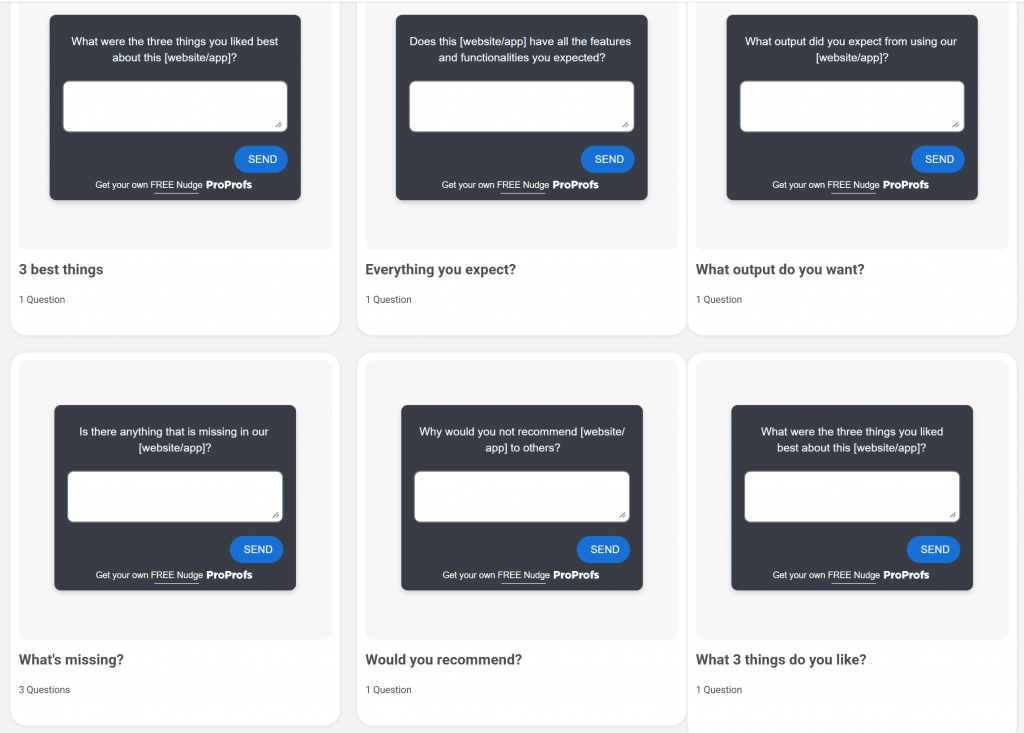
Feature Feedback Questions
- How often do you use [Feature Name]? (Daily / A few times a week / Occasionally / Rarely)
- How would you rate [Feature Name] on ease of use? (1-5)
- How disappointed would you be if [Feature Name] were removed? (Not at all / Somewhat / Very disappointed)
- What’s one thing we could change to make [Feature Name] more useful for your workflow?
Here are a few feature/functionality feedback survey templates:
Post-Support CSAT Questions
- How satisfied are you with the support you received today? (1-5)
- Did this interaction resolve your issue? (Yes / Partially / No)
- What’s one thing we could have done better?
Here’s a template for customer service feedback:
Onboarding Feedback Questions
- How easy was it to complete your first [core action] in [Product Name]? (Very easy / Easy / Difficult / Very difficult)
- What, if anything, slowed you down during setup?
- What did you expect to be able to do that you couldn’t find?
Common Survey Mistakes That Corrupt Your Data
Most survey errors don’t look like errors when you make them. They show up later, when the data doesn’t hold up to scrutiny, or the responses sit untouched because nobody knows what to do with them.
| Mistake | What Goes Wrong | The Fix |
| No Sample Size Target | You collect responses until it “feels like enough” and publish early on unreliable data. | Calculate your target before launch (~278 responses for 1,000 users at 95% confidence). If you’re not on track after two weeks, widen the targeting window. |
| Surveying the Same Audience Too Often | Respondents dismiss surveys on sight. Response quality drops before response rate does. | Set a 30-day suppression window per user. Never run NPS and a research survey simultaneously on the same segment. |
| Reversing Scale Directions Between Surveys | You can’t compare results across waves because 1 meant “worst” last month and “best” this month. | Lock one direction across every survey you run (1 = worst, 5 = best). Document it so it survives team turnover. |
| Leading Questions | “How has [Feature] improved your workflow?” pushes respondents toward confirmation before they’ve answered. | Have someone outside your team read every question and flag anything that assumes a direction. Neutral framing is harder than it looks from the inside. |
| No Owner, No Deadline | Five hundred responses land in a CSV in someone’s downloads folder and stay there. | Before launch, name the owner, the decision the data informs, and the date by which that decision gets made. If you can’t do all three, the survey isn’t ready. |
| Skipping Open-Ended Analysis | The most diagnostic feedback sits unread because processing free-text at scale feels impossible. | Use sentiment analysis to sort by emotion first, then read the negatives in full. Qualaroo’s IBM Watson-powered Sentiment Analysis does this automatically. |
Start With One Survey That Answers One Question
The most common reason survey programs stall is that teams try to build a comprehensive feedback operation before they’ve validated a single methodology. Start narrower.
Pick the one decision your team needs to make in the next 30 days that real user data would make easier.
Write the objective sentence. Define the audience. Deploy one survey using Qualaroo, collect to your sample target, and act visibly on what you find.
That single closed loop, from question to decision to visible change, is what builds internal confidence in surveys as a tool and external trust from users who see their feedback matter.
Frequently Asked Questions
What is the ideal length for a survey?
Under 5 minutes or 10-12 questions, whichever you hit first. PointerPro’s 2024 research shows a 17% drop in response rate once either threshold is crossed. If your research requires more depth, break it into two shorter surveys deployed at different points in the user journey rather than asking everything at once.
What is the difference between response rate and completion rate?
Response rate is the percentage of people who answered at least one question out of everyone who received the survey. Completion rate is the number of people who finished out of those who started. A high response rate with a low completion rate usually means the opening question works, but the survey loses people partway through, typically because of length, a confusing question, or a sudden drop in relevance.
How many responses do you need for survey data to be reliable?
For a target population of 1,000 users, you need roughly 278 completed responses for 95% confidence at a 5% margin of error. For 10,000 users, the number is around 370. Set your target before launch, then make your targeting window wide enough to hit it at your expected response rate.
Why do surveys fail to produce actionable data?
Usually one of four reasons: the objective was too vague to drive a specific decision, the wrong audience responded, the questions were leading or double-barreled, or the analysis stopped at raw responses without anyone owning a next action. The methodology in this guide addresses all four.
What is skip logic and why does it matter for data quality?
Skip logic routes each respondent to different follow-up questions based on their previous answers, so mobile users only see questions about the mobile experience and web users only see questions about the browser. It keeps surveys short, every question relevant, and your dataset clean without manual filtering after collection.
How do you stop the same person from responding twice?
For website surveys, cookie suppression identifies respondents who've already completed the survey and hides it on return visits. For logged-in product users, tie completion to a user ID so the same account can't submit twice. IP-based suppression covers anonymous visitors as a fallback. Most modern survey tools handle all three natively.
When is the right time to deploy a survey?
As close to the moment of experience as possible. A post-purchase CSAT on the order confirmation page captures the experience while it's fresh. The same survey sent by email two days later captures a reconstruction. Feature feedback works best immediately after the user completes the workflow. Exit intent surveys work at the exact moment of abandonment. The further from the moment, the less reliable the data.
How do you analyze open-ended survey responses at scale?
For under 100 responses, manual reading with a categorization pass works. For anything larger, use AI-based sentiment analysis that automatically scores each response and surfaces the most frequent themes. Qualaroo's IBM Watson-powered Sentiment Analysis does this natively, letting you filter to negative responses first and triage the most critical feedback in minutes rather than days.
FREE. All Features. FOREVER!
Try our Forever FREE account with all premium features!
 We'd love your feedback!
What did you like & how can we make it even better?
 Thanks for your feedback!
 Ask Your Question
Have a question? Get expert help to make your decision easier.