I’ve seen this moment in more companies than I can count.
A dashboard goes up. Someone says, “CSAT is up, and NPS looks fine.” Then the real update hits: churn climbed, renewals got tougher, and expansion slowed down.
So the only question that matters becomes impossible to ignore: if customers are “satisfied,” why are they leaving?
Most teams don’t have a customer satisfaction metrics problem. They have a systems problem. Customer data is spread across tools, scores don’t match, and surveys show up at the wrong time.
This guide keeps things simple. I’ll narrow customer satisfaction metrics down to the 7 that actually pull their weight. For each one, you’ll get what it measures, when to use it, what usually goes wrong, and the next step.
If you want fewer vanity scores and clearer decisions, let’s get into it.
What Are Customer Satisfaction Metrics?
Customer satisfaction metrics are the numbers that tell you how customers feel about your product or service and, more importantly, what they’re likely to do next.
Stay with me, because this is where teams go wrong.
Most companies treat these metrics like trophies. They track them, report them, and celebrate when they go up. But a score is only useful if it helps you answer three practical questions:
- What’s working right now?
- What’s causing friction and drop-offs?
- Who’s at risk, and what will protect revenue?
To make that happen, customer satisfaction metrics fall into three buckets. Think of them like a simple toolkit, not a giant menu.
Key Types of Customer Satisfaction Metrics
- Transactional Metrics: These measure satisfaction right after a specific interaction, like a support chat or onboarding step. They’re great for finding what to fix this week.
- Relational Metrics: These measure the overall relationship and loyalty over time. Useful for leadership trends and understanding whether you’re building advocates or quietly creating churn.
- Behavior-And-Outcome Metrics: These connect sentiment to what customers actually do: stick around, expand, downgrade, or leave. This is the bucket that helps you link experience to revenue without hand-waving.
Here’s the punchline: you don’t need 20 metrics to understand satisfaction. You need a small set that covers all three buckets, so your numbers don’t fight each other, and your team doesn’t drown in dashboards.
That’s why we’re keeping it to the seven that matter most.
The 7 Most Important Customer Satisfaction Metrics
Tracking every metric sounds responsible until your numbers start arguing with each other, and nobody knows what to fix first.
These customer satisfaction metrics work as a system. They cover the full loop: how customers feel in the moment, how loyal they are over time, where friction is building, how support performs, who’s at risk of churn, and what drives revenue.
1. Customer Satisfaction Score (CSAT)
CSAT answers one very specific question: how did this interaction go?
It’s the quickest way to understand how customers feel right after something happens—closing a support ticket, finishing onboarding, completing a checkout, or using a new feature. When CSAT works, it gives you fast, directional feedback on moments that actually matter.
Where teams mess this up is the scope. CSAT isn’t meant to describe the entire customer relationship. When you use it too broadly or too often, it turns into background noise.
How CSAT Is Calculated
Most teams calculate CSAT as the percentage of positive responses:
CSAT = (Number of Satisfied Responses ÷ Total Responses) × 100
“Satisfied” typically means:
- 4 and 5 on a 5-point scale, or
- “Satisfied” and “Very satisfied.”
Simple Example: If 82 out of 100 respondents rate their experience as a 4 or 5, your CSAT is 82%.
What CSAT Is Good At
- Spotting broken or frustrating experiences fast
- Comparing performance across teams, channels, or releases
- Catching issues before they snowball into churn
What CSAT Is Bad At
- Predicting long-term loyalty
- Explaining why customers feel the way they do on its own
Simple Example: If post-support CSAT drops from 4.6 to 3.9 in two weeks, something changed. Maybe response times slipped, maybe a new policy confused customers. CSAT doesn’t give you the answer, but it tells you exactly where to look.
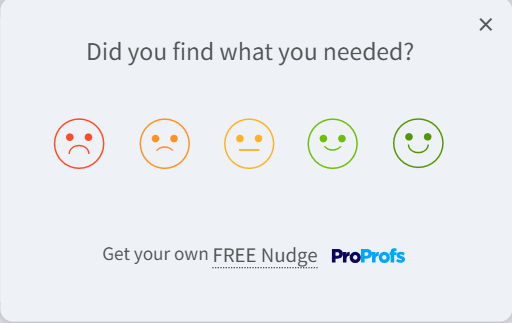
Next Step to Take: Always pair CSAT with one short follow-up question like “What could we have done better?” Then review low scores weekly, not quarterly. Here’s a quick 3-question CSAT template you can use:
2. Net Promoter Score (NPS)
NPS answers a different question: how strong is the relationship overall?
It’s not about a single interaction. It’s about trust, confidence, and whether customers would put their reputation on the line to recommend you. That’s why leadership likes it—and why it often gets misunderstood.
On its own, NPS is a blunt instrument. A high score can hide friction. A flat score can mask growing risk. Used correctly, it’s a long-term signal, not a daily control knob.
How NPS Is Calculated
Customers are grouped based on their response to a 0–10 question:
- Promoters: 9–10
- Passives: 7–8
- Detractors: 0–6
The formula is simple: NPS = % of Promoters − % of Detractors
Simple Example: If 55% of respondents are Promoters and 20% are Detractors, your NPS is +35.
In fact, I also have a quick video for you to learn how to calculate NPS:
What NPS Is Good At
- Tracking loyalty trends over time
- Comparing sentiment across customer segments
- Identifying promoters and detractors for follow-up
What NPS Is Bad At
- Diagnosing specific problems
- Explaining churn without additional context
Simple Example: Two customers both gave you a 9. One is growing usage every month. The other barely logs in anymore. Same score, very different futures. NPS alone won’t tell you that difference.
Next Step to Take: Segment NPS by customer type, tenure, or usage patterns. Treat it as a directional health check, then use other metrics to explain the “why.” Here’s an easy NPS template for you to use:

3. Customer Effort Score (CES)
CES answers one question most satisfaction metrics miss: how hard was it for the customer to get what they wanted?
Customers don’t leave because an experience wasn’t delightful. They leave because it was annoying, slow, or unnecessarily complicated. That’s why effort is such a strong predictor of churn.
CES is best used after moments that involve friction: resolving an issue, completing a setup, finding information, or getting a task done.
How CES Is Calculated
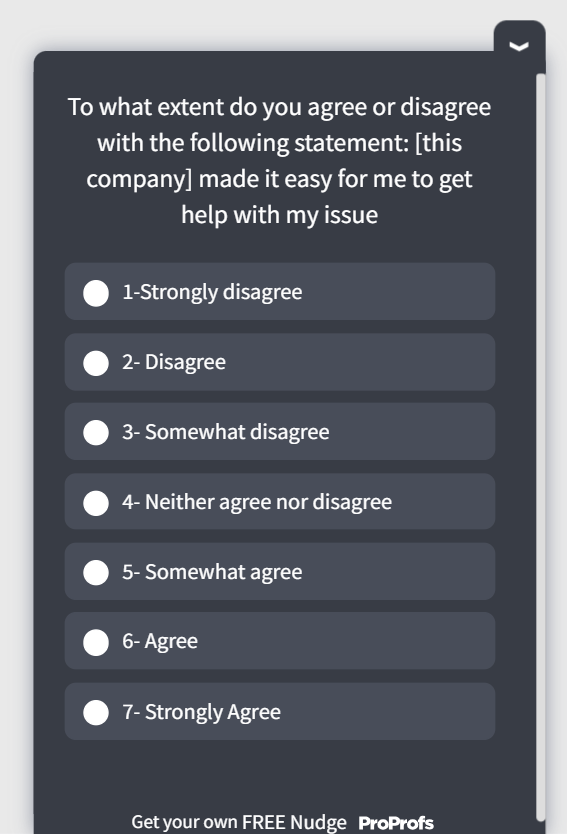
CES is usually measured using a 5- or 7-point agreement scale around a statement like:
“The company made it easy for me to resolve my issue.”
You can calculate it as an average score or as a percentage of low-effort responses.
CES = (Total CES Score ÷ Number of Responses)
Simple Example: If 50 customers rate effort on a 1–7 scale and the total score is 260, your CES is 5.2.
What CES Is Good At
- Predicting churn before satisfaction drops
- Identifying hidden friction in journeys that “work”
- Prioritizing fixes that reduce support load
Where CES Goes Wrong
- Used after every interaction, even low-friction ones
- Tracked without linking it to behavior like repeat usage or churn
Next Step to Take: Trigger CES only after known friction points, then correlate low scores with follow-up actions like repeat tickets or drop-offs. Here’s a CES template you can use:
4. Customer Service Satisfaction (CSS)
CSS zooms in on one thing: how customers feel about your support experience.
Unlike CSAT, which can be used across many interactions, CSS is specifically about service quality, like agent helpfulness, clarity, and resolution confidence.
It’s especially important because support interactions tend to carry more emotional weight than product usage. One bad service experience can undo months of goodwill.
How CSS Is Calculated
CSS is commonly measured using a short post-support survey with one or more questions, such as:
“How satisfied are you with the support you received?”
The calculation mirrors CSAT:
CSS = (Number of Positive Service Ratings ÷ Total Service Responses) × 100
Simple Example: If 72 out of 90 customers rate support as “satisfied” or higher, your CSS is 80%.
What CSS Is Good At
- Measuring agent and team performance
- Identifying training or process gaps
- Tracking service quality across channels
Where CSS Goes Wrong
- Confused with overall customer satisfaction
- Measured without tying outcomes to resolution or effort
Next Step to Take: Review low CSS responses alongside CES and First Contact Resolution to understand whether dissatisfaction comes from attitude, effort, or unresolved issues. Here’s a customer support template you can use:

5. Customer Health Score (CHS)
Customer Health Score answers a question surveys can’t: who is quietly drifting toward the exit?
CHS isn’t a single survey or question. It’s a composite score built from customer behavior and signals over time. That’s what makes it powerful. By the time satisfaction scores drop, many customers have already decided to leave. Health scores surface that risk earlier.
How CHS Is Calculated
There’s no universal formula, but most teams combine a weighted set of signals, such as:
- Product usage frequency
- Feature adoption
- Support interactions
- Recent satisfaction scores
- Contract or billing changes
A simple version looks like this:
CHS = (Usage Score × Weight) + (Support Score × Weight) + (Satisfaction Score × Weight)
Customers are then grouped as healthy, at risk, or critical.
Simple Example: A customer logs in less often, opens more tickets, and gives a low CES score. Their combined health score drops, even if they haven’t complained directly.
What CHS Is Good At
- Identifying churn risk before renewal conversations
- Prioritizing customer success outreach
- Separating noisy feedback from real risk
Where CHS Goes Wrong
- Overcomplicated scoring models no one trusts
- Health scores that aren’t tied to action
Next Step to Take: Start simple. Pick three signals you already track, score them consistently, and review declining health weekly with a clear owner.
6. Customer Churn Rate (CCR)
Customer Churn Rate is the reality check. It answers a blunt question: how many customers are you losing?
No satisfaction metric matters if churn is rising. CCR forces teams to connect experience data to outcomes, not just opinions.
How CCR Is Calculated
The basic formula is straightforward:
CCR = (Customers Lost During Period ÷ Customers at Start of Period) × 100
Simple Example: If you start the quarter with 1,000 customers and lose 80, your churn rate is 8%.
What CCR Is Good At
- Measuring the real cost of poor experiences
- Tracking retention trends over time
- Holding teams accountable to outcomes
Where CCR Goes Wrong
- Used without understanding why customers left
- Reviewed too late to prevent damage
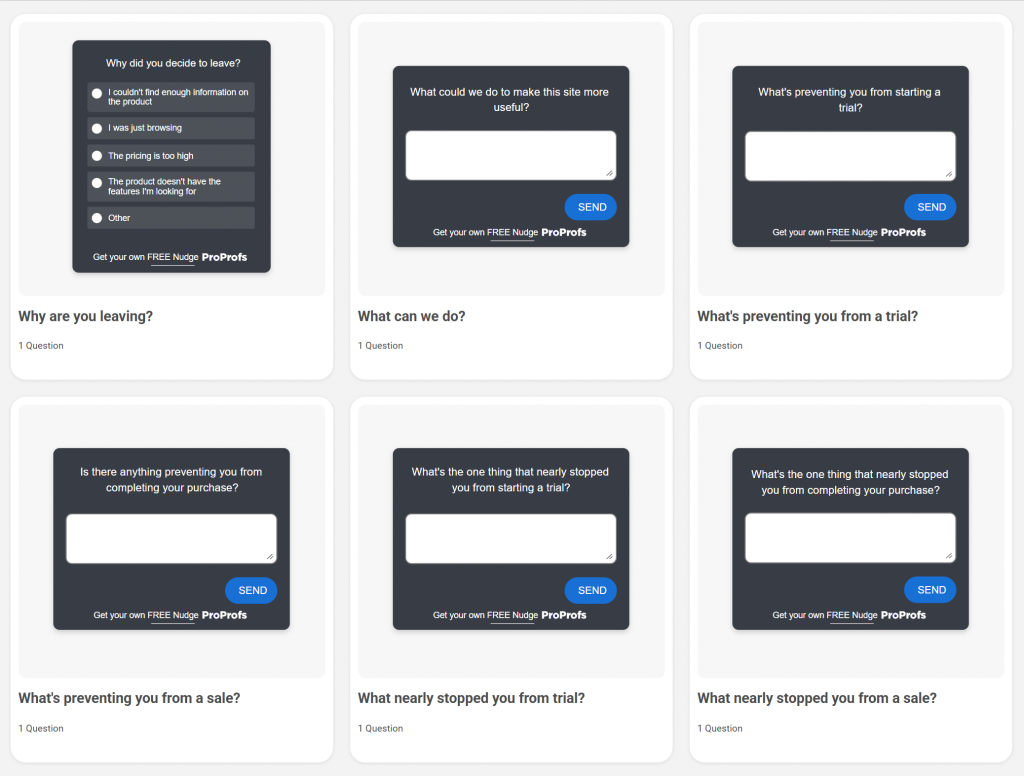
Next Step to Take: Always review churn alongside CES, CSAT, and CHS. Run churn retrospectives to identify the experience patterns that show up before customers leave. To gauge churn, you can use exit-intent survey templates:
7. Value Enhancement Score (VES)
Value Enhancement Score answers the question most leadership teams actually care about: Did this experience increase the customer’s sense of value?
Satisfaction alone doesn’t guarantee growth. Customers can be “satisfied” and still hesitate to renew, upgrade, or recommend you. VES focuses on something more predictive—whether an interaction made customers feel more confident about using, buying, or continuing with your product.
That’s what makes it especially useful after support, onboarding, or success-led interactions.
How VES Is Calculated
VES is typically measured using two statements, rated on a 7-point agreement scale:
- “After this interaction, I feel I can achieve more with the product or service.”
- “After this interaction, I feel more confident in my decision to continue using or purchasing.”
You calculate VES as the average of both responses:
VES = (Score Question 1 + Score Question 2) ÷ 2
Simple Example: If a customer rates the first statement a 6 and the second a 5, their VES is 5.5.
What VES Is Good At
- Linking experience quality to expansion and retention
- Measuring the impact of support and success teams
- Predicting repeat purchase and advocacy
Where VES Goes Wrong
- Used as a standalone metric without context
- Deployed too early, before customers see real value
Next Step to Take: Use VES after moments where customers should feel more capable or confident. Track it alongside renewal rates and expansion to prove which experiences actually grow revenue.
How to Measure Customer Satisfaction Without Survey Fatigue
Most survey fatigue isn’t caused by surveys themselves. It’s caused by bad timing, too many questions, and zero visible action.
Customers are generally willing to give feedback when it’s easy, relevant, and clearly tied to something they just experienced. They stop responding when surveys feel random or pointless.
Here’s how modern teams measure customer satisfaction without burning goodwill.
1. Measure Moments, Not Relationships
Don’t ask customers how they feel “overall” every few weeks. Ask them right after something meaningful happens:
- A support ticket is resolved
- Onboarding is completed
- A feature is used for the first time
- A checkout or upgrade attempt ends
Event-based feedback feels natural. Generic check-ins feel like homework.
2. Pick Metrics Based on Your Goal
- If churn is the fire: CES, CHS, CCR
- If support is the bottleneck: CSAT, CSS, CES
- If expansion is the goal: VES, NPS, CHS
3. Ask One Question, Then Listen
One clear question beats five vague ones every time.
Start with a single metric question (CSAT, CES, or VES), then add one optional follow-up for context. Long forms kill response rates and rarely improve insight.
4. Rotate Metrics Instead of Stacking Them
You don’t need to ask CSAT, NPS, and CES in the same flow. Use each metric where it fits best:
- CSAT for transactions
- CES for friction points
- NPS for periodic relationship checks
This keeps feedback fresh and reduces over-surveying the same users.
5. Combine Surveys With Behavioral Signals
Surveys tell you how customers feel. Behavior tells you what they’re about to do.
Watch for signals like:
- Drop in product usage
- Repeated support requests
- Feature abandonment
- Account downgrades or data exports
When sentiment and behavior move together, you have a real insight. When they don’t, dig deeper.
6. Close the Loop Publicly
Nothing kills response rates faster than silence.
If customers give feedback, show them it mattered. Even a short follow-up or visible product change builds trust and keeps future responses coming.
Rule of thumb: if you can’t act on the feedback, don’t ask for it.
Customer Satisfaction Metrics Examples (With Sample Data)
Metrics only become useful when you can see how they behave in real situations. Below are a few simple examples that show how customer satisfaction metrics work together, and why looking at one score in isolation often leads you in the wrong direction.
Example 1: CSAT Looks Healthy, But CES Tells A Different Story
A support team tracks CSAT after every resolved ticket.
- Average CSAT: 88%
- CES average: 4.1 out of 7
- Repeat tickets within 7 days: High
On the surface, things look fine. Customers are “satisfied” with the interaction. But CES shows they’re working harder than they should. When you look closer, agents are polite and responsive, but issues take multiple steps to resolve.
What This Means: Customers aren’t unhappy, but they’re frustrated. That friction shows up later as higher support volume and eventual churn.
What to Do Next: Focus on reducing steps to resolution, not just improving agent tone.
Example 2: NPS Is Flat, But Customer Health Is Dropping
An SaaS company runs a quarterly NPS survey.
- NPS: +32 (unchanged)
- Product usage among mid-tier accounts: Down 18%
- Customer Health Score: Declining
The NPS score suggests stability, but health scores show reduced engagement. By the time NPS eventually dips, renewals are already at risk.
What This Means: NPS is lagging behind in behavior. Loyalty sentiment hasn’t caught up to reality yet.
What to Do Next: Trigger proactive outreach when health scores fall, not when NPS drops.
Example 3: High VES Predicts Expansion
After onboarding, customers are asked two VES questions.
- Average VES: 5.9 out of 7
- Expansion rate after 90 days: 2× higher than low-VES accounts
Customers who feel more capable and confident after onboarding don’t just stay—they grow.
What This Means: Value perception drives revenue more reliably than satisfaction alone.
What to Do Next: Double down on the onboarding moments that raise VES, and replicate them across customer success touchpoints.
FREE. All Features. FOREVER!
Try our Forever FREE account with all premium features!
How to Fix the Biggest Problems Teams Face With Customer Satisfaction Metrics
If customer satisfaction metrics feel messy, you’re not imagining it. Most teams run into the same few problems. The good news is they’re fixable without rebuilding your entire stack.
| Problem | Quick Symptom | Fix | Next Step |
|---|---|---|---|
| Data Is Spread Across Tools | “Where’s the real number?” | One source of truth | Build one dashboard fed by Survey + Support + Usage |
| Metrics Do Not Agree | CSAT up, churn up | Treat metrics as signal types | Tag each metric: Moment / Friction / Relationship / Outcome |
| Survey Fatigue | Low response rates | Event-based microsurveys | Ask 1 question right after key moments; rotate metrics |
| No Link to Revenue | Leadership says, “So what?” | Correlate scores to outcomes | Compare high vs. low scores against retention/expansion |
| Feedback Goes Nowhere | Same complaints repeat | Close the loop | Ship a monthly “You said, we did” update with owners |
Turning Customer Satisfaction Metrics Into Revenue Insights
By this point, the metrics should be clear. What usually isn’t clear is how to present them in a way that leadership will act on.
The mistake most teams make is reporting satisfaction as performance. Executives don’t need to know that CSAT moved from 82 to 85. They need to know whether that change affects retention, expansion, or risk.
1. Build One Revenue View Per Metric
Each metric should answer a money question:
- CES: Where is friction putting renewals at risk?
- CHS: Which accounts need intervention this quarter?
- VES: Which experiences increase the likelihood of expansion?
If a metric can’t be tied to a decision or a dollar outcome, it doesn’t belong in an exec readout.
2. Show Risk and Upside, Not Scores
Replace trend charts with comparisons:
- Accounts with low CES vs high CES
- Customers with declining health vs stable health
- High-VES cohorts vs low-VES cohorts
The gap between those groups is the business case.
3. Speak in Scenarios, Not Percentages
Instead of saying:
“Churn increased by 1.2%”
Say:
“Accounts showing low effort scores three months before renewal are churning at 2× the normal rate.”
That turns a metric into a forecast.
4. Use Metrics to Fund Change
The end goal is not better reporting. It’s easier to prioritize.
When satisfaction metrics point to specific revenue risk or upside, they stop being debated and start being funded.
Final Thoughts: Treat Metrics Like a System, Not a Scorecard
Customer satisfaction metrics are easy to collect and surprisingly easy to misuse.
When they live in silos, show up at random moments, or exist only to be reported, they create more confidence than clarity. Teams feel informed, but decisions still stall. Customers keep leaving quietly. Revenue takes the hit later.
The shift is simple, but not easy: stop treating metrics as individual scores and start treating them as a connected system.
Each metric in this guide has a job. Some tell you how customers feel in the moment. Others surface friction, loyalty, or risk. A few connect experience directly to value and growth. When you use them together, and only where they make sense, you stop chasing numbers and start fixing real problems.
This is where a tool like Qualaroo earns its keep. It helps you collect feedback in the moment with targeted, one-question surveys, so you’re not spamming customers or relying on low-response email blasts.
Frequently Asked Questions
What are the 7 different ways to measure customer satisfaction?
You can measure customer satisfaction using seven complementary methods: CSAT for transactional sentiment, NPS for loyalty, CES for ease, CSS for support quality, CHS for churn risk, CCR for actual retention outcomes, and VES for perceived value and confidence. Together, they cover feelings, effort, risk, and growth.
What are the four metrics of customer service?
Four widely used customer service metrics are CSAT, CSS, CES, and First Contact Resolution. CSAT and CSS reflect how customers felt about the support experience; CES shows how easy it was to get help; and FCR captures whether issues were resolved in a single interaction.
What are the 5 factors of customer satisfaction?
Customer satisfaction is typically shaped by ease of use, speed of response, clarity of communication, perceived value, and consistency across touchpoints. When customers can get results quickly, understand what’s happening, feel the product is worth it, and see reliable experiences, satisfaction, and loyalty rise.
FREE. All Features. FOREVER!
Try our Forever FREE account with all premium features!
 We'd love your feedback!
What did you like & how can we make it even better?
 Thanks for your feedback!
 Ask Your Question
Have a question? Get expert help to make your decision easier.