
Every product team has been there. You run a feature survey, and every single item comes back “very important.”
You ask customers what they’d pay, and no one says less than what you’re already charging. You make a pricing call based on gut feel, and it lands somewhere in the middle.
Conjoint analysis exists because direct questions produce aspirational answers.
When you ask people to choose between realistic product configurations at different prices, they reveal what they actually value by what they actually give up.
I tested and reviewed the leading 10 conjoint analysis tools available to help product managers, UX researchers, and CX leads find the right fit.
This list covers dedicated conjoint platforms, full-suite survey tools with conjoint modules, and how Qualaroo fits into the research stack as the qualitative layer most conjoint workflows are missing.
What Is Conjoint Analysis Software?
Conjoint analysis software is a research platform that designs, fields, and analyzes trade-off studies to measure how customers value different product attributes, features, and prices. Instead of asking respondents what they want, it presents sets of complete product options and asks them to choose.
By modeling those choices statistically, the software calculates part-worth utilities: quantified scores for each attribute level that reveal what actually drives decisions, not just what customers say drives them.
The category spans purpose-built conjoint platforms, modules inside broader survey tools, and statistical analysis environments used by market research professionals.
7 Conjoint Analysis Tools That Made My List
I narrowed this list to tools that cover the full range of how product and research teams actually use conjoint: from lightweight self-serve CBC for a one-off pricing study to enterprise-grade platforms for repeatable research programs.
I also included Qualaroo because the qualitative gap conjoint leaves open is a real problem, and most lists ignore it entirely.
The comparison table below gives you a quick view; the in-depth reviews follow.
| Tool | Best For | Key Features | Pricing | Rating (Capterra) |
| Qualaroo | In-App surveys, NPS & user feedback | Nudge™ surveys, AI survey creation and sentiment analysis, behavioral targeting, and the Identify API | From $19.99/month | 4.7/5 |
| Conjointly | All-in-one CBC, MaxDiff, and pricing research | Drag-and-drop study builder, automated PowerPoint reports, market simulator | Free Basic; paid plans from €2,545/team/year | 4.5/5 |
| Sawtooth Discover | Advanced professional conjoint research | CBC, ACBC, HB estimation, market simulation, no per-respondent fees | Custom pricing | 4.6/5 |
| QuestionPro Research Suite | Mid-market teams needing CBC within a full survey platform | ACA, CBC, ACBC, MaxDiff, TURF, HB modeling | Custom pricing | 4.8/5 |
| Displayr | Analysts who need conjoint plus full statistical reporting | Automated conjoint simulation, branded dashboards, segmentation | From $3,359/user (billed annually) | 4.8/5 |
| 1000minds | Healthcare, policy, and prioritization research | PAPRIKA adaptive method, pairwise trade-off tasks, market simulator | Custom pricing | 4.9/5 (Only 19 reviews) |
| SurveyKing | Budget-conscious teams running simple CBC studies | CBC module, respondent-level utilities, market-share simulation | From $19/mo | Not listed on Capterra; 4.3/5 (G2) |
Now, the in-depth review:
1. Qualaroo: Best for In-App Surveys, NPS & User Feedback
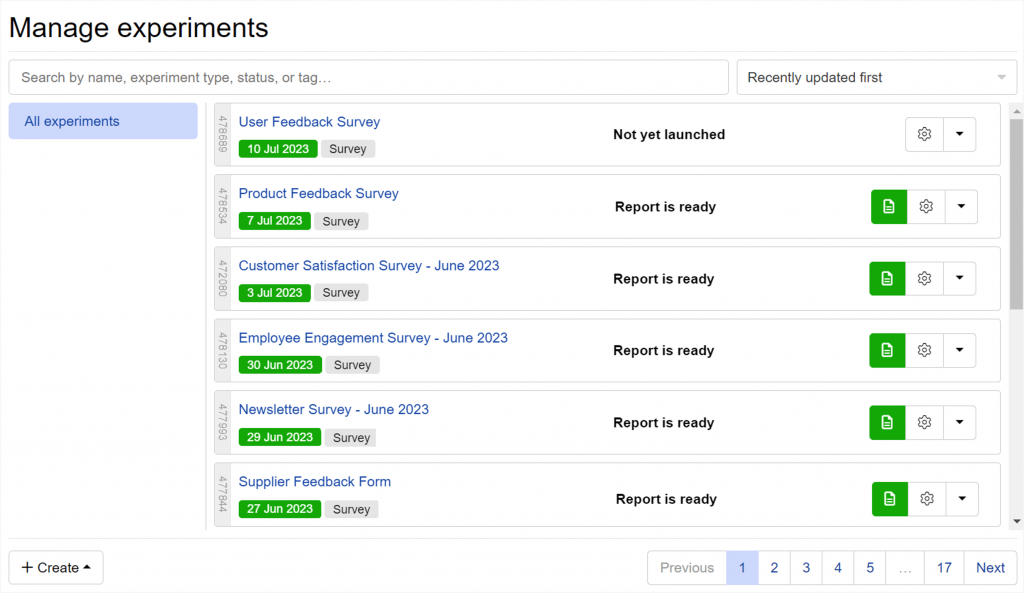
Qualaroo is a user and customer feedback platform built around the Nudge™, a non-intrusive micro-survey that fires on your website, web app, or mobile product while users are actively engaged.
It captures feedback at the moment of decision: on the pricing page, at the feature gate, during onboarding. Moreover, you can create your surveys in seconds using AI.
For conjoint research, Qualaroo solves the attribute selection problem. Before running a study, you need to know which features actually drive your users’ decisions.
Nudge™ surveys placed at key decision points surface what users are weighing in their own words, so your conjoint design tests the right variables instead of the ones you assumed mattered.
After conjoint, the utility scores tell you what customers prefer but not why. Qualaroo’s Identify API links every response to a real user by email or customer ID, so you can segment follow-up Nudge™ surveys by plan type or usage tier and ask the exact right question to the exact right person.
AI Sentiment Analysis categorizes and scores open-text responses at scale, so you are not manually reading through hundreds of answers to find the signal.
Session Recordings and Heatmaps add the behavioral layer when stated preference and observed behavior diverge.
Pros:
- An AI survey creator for easy and fast survey generation.
- AI Sentiment Analysis categorizes open-text feedback at scale without manual tagging.
- Session Recordings and Heatmaps surface behavioral signals that conjoint data alone cannot explain.
- Nudge™ format captures feedback in the moment of decision, not after the session ends
- Branching & skip logic for relevant questions.
- Identify API links responses to real users by email, plan type, or customer ID for precise segmentation
- Nudge™ for prototypes on Figma, Adobe XD, InVision, and more.
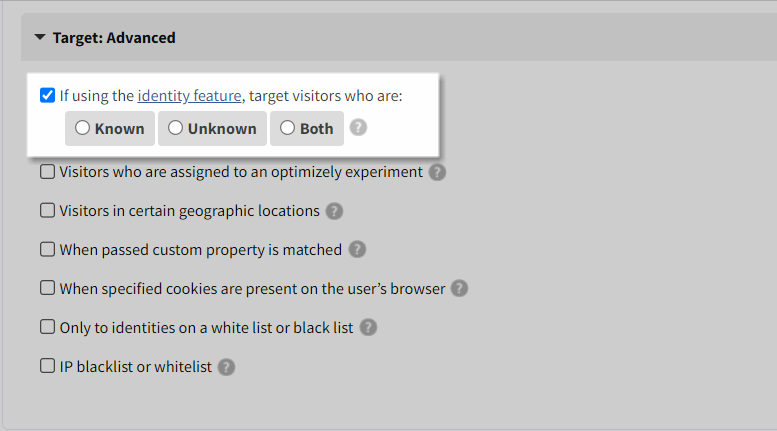
- Advanced targeting based on identity, custom properties, behavior, geolocation, exit intent, and more.
- Multilingual surveys in over 70 languages.
- Customizable branding, colors, and logo.
- In-app surveys for iOS and Android.
Cons:
- Not a dedicated conjoint tool; it fills the qualitative layer around conjoint, not the statistical modeling layer
- Free plan is limited to 50 responses; advanced targeting and mobile Nudge™ require a paid plan
User Rating: 4.7/5 (Capterra)
Pricing: Free plan available with all premium features. Paid starts at $19.99/month
2. Conjointly: Best for All-in-One CBC, MaxDiff, and Pricing Research
Conjointly is a browser-based platform built for conjoint analysis and related pricing research methods.
It supports CBC, ACBC, MaxDiff, Van Westendorp, and Gabor-Granger pricing tests within a drag-and-drop builder that does not require a statistician to operate.
You set up the experimental design, the platform generates the fractional factorial layout, you field to your own panel or Conjointly’s, and the output comes back as a market simulator and exportable PowerPoint report. Most teams can run the full workflow without any statistical consulting.
One real limitation: each survey is locked to a single study type. If you need a conjoint exercise and a MaxDiff in the same instrument, that is not possible within Conjointly.
Pros:
- Full study lifecycle from experimental design to automated PowerPoint output in one platform
- Supports CBC, ACBC, MaxDiff, Van Westendorp, and Gabor-Granger in a no-code interface
- Market simulator lets you model preference shares for any product configuration before committing
- Basic tier is free and allows small studies across advanced analytics methods
Cons:
- Each survey is locked to a single study type; combining methods in one instrument is not supported
- Limited statistical transparency: the platform produces high-quality designs but does not surface D-efficiency scores or model diagnostics for advanced users
User Rating: 4.5/5 (Capterra)
Pricing: Free Basic tier; paid plans from €2,545/team/year
3. Sawtooth Discover: Best for Advanced, Academically Rigorous Conjoint Programs
Sawtooth Software has been the market research industry’s reference platform for conjoint analysis since the late 1980s.
Discover is the cloud-based version, built for researchers who need rigorous CBC and MaxDiff without the complexity of the full Lighthouse Studio desktop environment.
What Sawtooth delivers that lighter tools cannot is methodological depth.
Hierarchical Bayes estimation produces individual-level utility scores even when each respondent sees only a fraction of all possible combinations, and the adaptive CBC engine adjusts tasks dynamically to reduce respondent fatigue.
At custom pricing and with no per-respondent fees, Sawtooth is the right call for teams running conjoint programs regularly. For teams running one study per year, the cost-per-study math is difficult to justify.
Pros:
- Hierarchical Bayes (HB) estimation for individual-level utility scores is the industry gold standard
- No per-respondent fees: fixed annual license with unlimited survey responses
- Full academic credibility; most peer-reviewed conjoint methodology references Sawtooth
- Market simulator with Simulation Insights Recommendation Engine for quick scenario testing
Cons:
- $4,500/user/year for Discover; Lighthouse Studio starts at $10,900 for a single seat
- Steep learning curve for advanced features like ACBC and custom design specifications
- Overkill for teams running occasional, lightweight pricing or feature studies
User Rating: 4.6/5 (Capterra)
Pricing: Custom pricing; contact Sawtooth for a quote
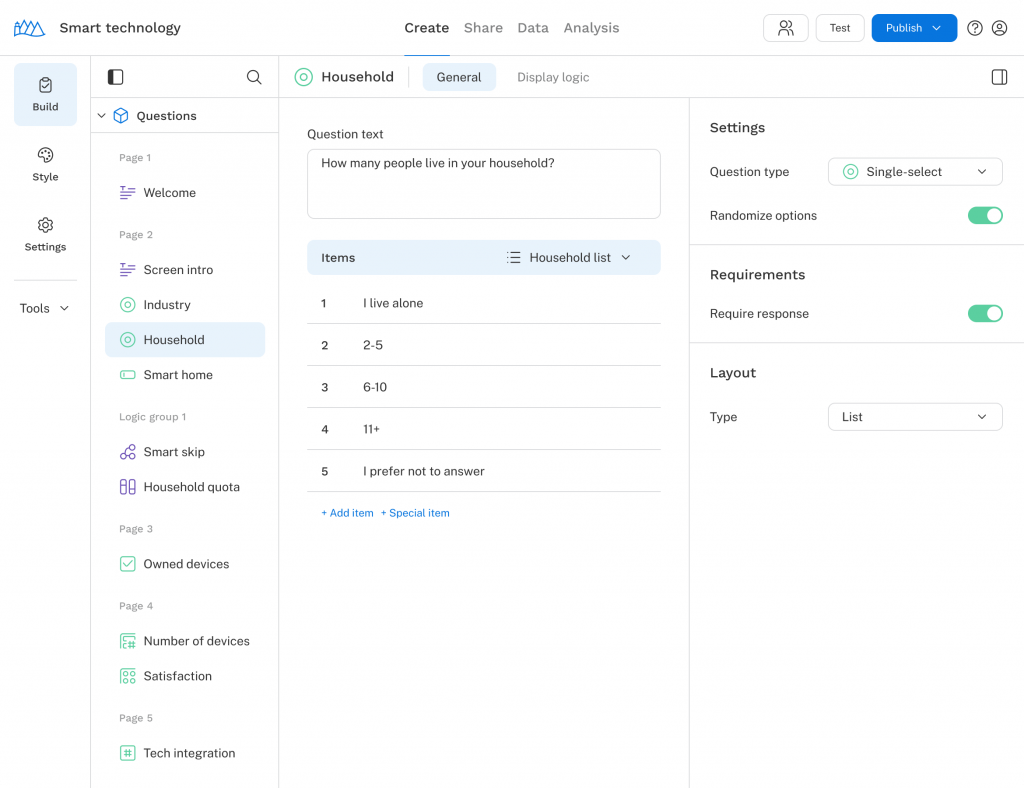
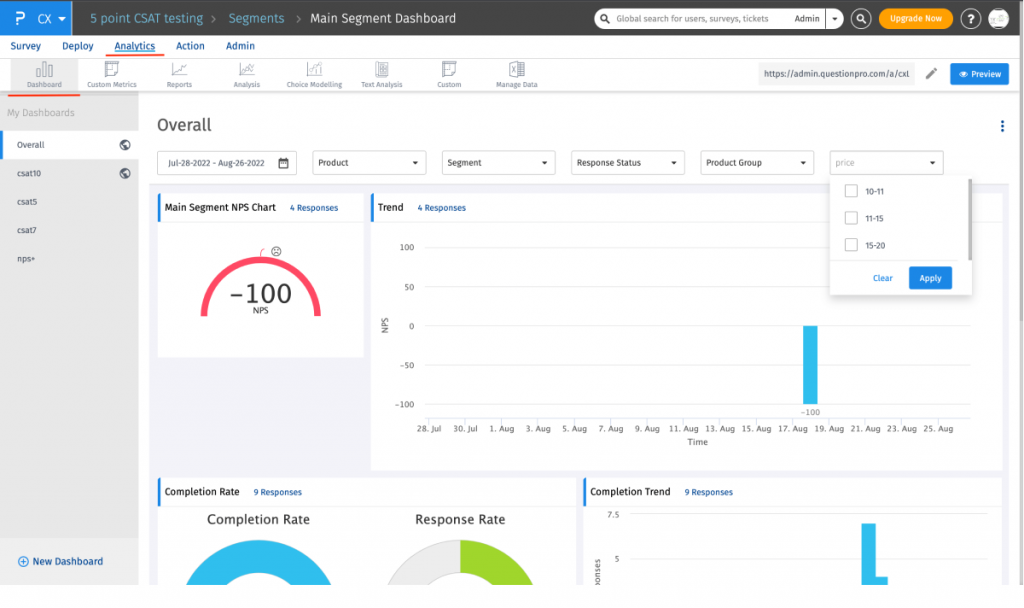
4. QuestionPro Research Suite: Best for Mid-Market Teams Needing CBC Inside a Full Survey Platform
QuestionPro’s Research Suite includes conjoint analysis, MaxDiff, and TURF alongside a full survey creation and distribution environment.
For teams that want to run CBC studies without switching platforms, it is the most accessible entry point that still includes HB modeling and market simulation.
The practical advantage is integration. You can embed trade-off tasks alongside screening questions, demographic captures, and follow-up rating scales in one instrument, which suits teams running mixed-method studies.
The constraint is access. Conjoint is locked behind the Research Suite plan, requires engaging the sales team, and offers no self-serve trial before committing.
Pros:
- CBC, ACBC, ACA, MaxDiff, and TURF in one platform, alongside full survey creation and distribution
- Supports hierarchical Bayes (HB) estimation and share-of-preference market simulation
- Embed conjoint tasks inside mixed-method studies without switching platforms
- Accessible interface for non-statisticians compared to dedicated professional tools
Cons:
- Conjoint is gated behind the Research Suite plan with custom pricing and no self-serve trial
- Advanced customization is limited compared to specialist platforms like Sawtooth
- The interface can feel overwhelming due to the volume of features across the full suite
User Rating: 4.8/5 (Capterra)
Pricing: Custom pricing; contact QuestionPro for Research Suite access
5. Displayr: Best for Analysts Who Need Conjoint Output Plus Full Statistical Reporting
Displayr is a data analysis and visualization platform used by market research professionals who need conjoint modeling paired with publication-ready statistical reporting.
It supports CBC, ACBC, and hierarchical Bayes estimation, and the standout feature is how it handles output: conjoint results automatically generate interactive, branded dashboards that update in real time as you adjust assumptions in the market simulator.
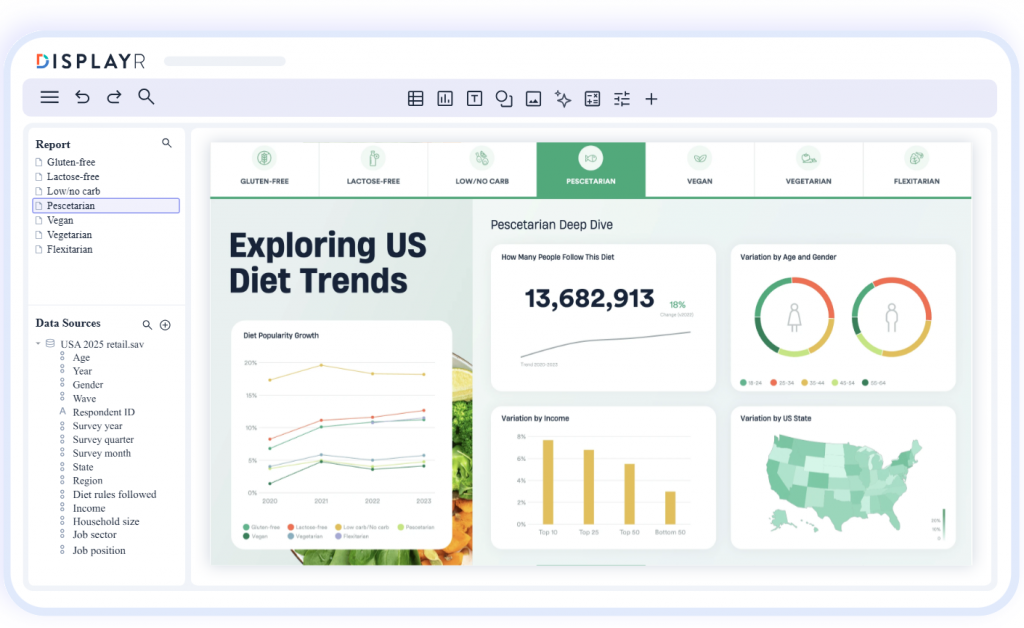
For research agencies or in-house research teams presenting conjoint results to non-technical stakeholders, that reporting layer is a significant time saver. Rather than exporting utility scores to Excel and rebuilding the charts for each scenario, Displayr maintains a live connection between the model and the presentation.
The tradeoff is that Displayr is fundamentally an analysis environment, not a survey tool. You bring the data in from your fielding platform; Displayr handles the modeling and output.
Pros:
- Conjoint simulation outputs automatically populate into shareable, brandable reports and dashboards
- Supports CBC, ACBC, and HB estimation with interactive market share simulators
- Strong segmentation tools for splitting utility scores across customer groups
- Designed for market research teams presenting results to clients or senior stakeholders
Cons:
- Not a survey fielding tool: you need a separate platform to collect conjoint responses
- Starts at $3,359/user/year; cost can be hard to justify for teams running occasional studies
- Steeper learning curve than browser-based tools for setup and template configuration
User Rating: 4.8/5 (Capterra)
Pricing: From $3,359/user/year
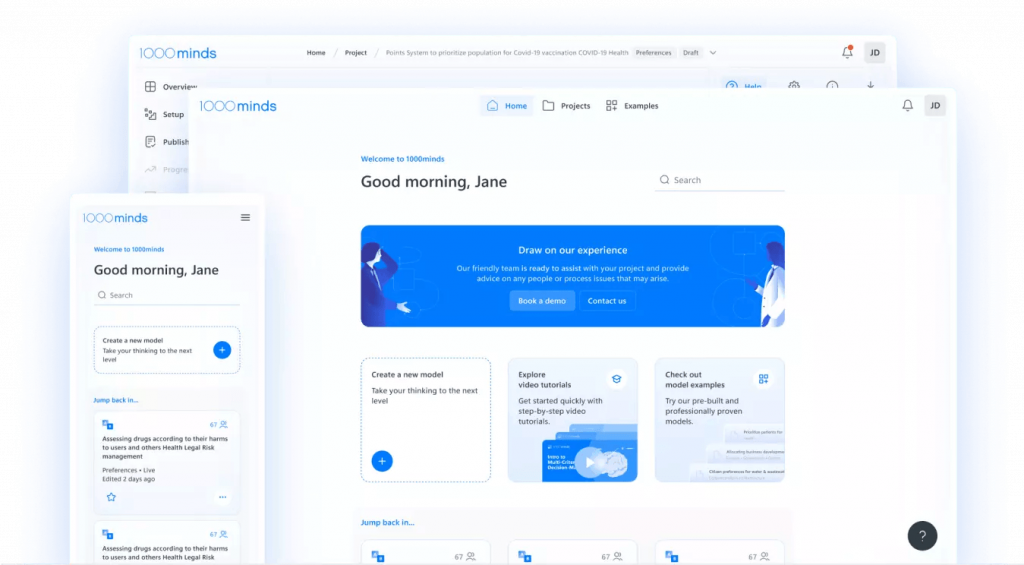
6. 1000minds: Best for Decision Research, Healthcare, and Policy Applications
1000minds is built around the PAPRIKA method, an adaptive conjoint method that presents respondents with pairwise trade-offs one at a time until their full preference ranking is inferred.
It is purpose-built for decision prioritization rather than consumer market modeling. The core use cases are institutional: healthcare organizations weighing clinical criteria, government agencies ranking policy attributes, and HR teams building compensation comparisons.
If your research question is about how stakeholders weigh criteria against each other, 1000minds fits where standard CBC does not.
It is not a tool for product pricing or feature trade-off research. Most SaaS product teams will find it the wrong fit unless the research question is explicitly about decision criteria rather than consumer preference.
Pros:
- Adaptive PAPRIKA method infers complete preference rankings from paired comparisons with low respondent burden
- Well-validated in healthcare, public policy, and organizational decision-making contexts
- Market simulator added in 2025 enables modeling of market shares for competing product offerings
- Intuitive for respondents: pairwise trade-offs are simpler to understand than full-profile conjoint tasks
Cons:
- Not designed for consumer pricing or feature trade-off research; a poor fit for most product teams
- Pricing is custom and not publicly listed; it is typically aimed at institutional buyers
- Niche methodology may require explanation to stakeholders unfamiliar with PAPRIKA
User Rating: 4.9/5 (Capterra, 19 reviews)
Pricing: Custom pricing; contact 1000minds for a quote
7. SurveyKing: Best for Budget-Conscious Teams Running Simple Choice-Based Conjoint
SurveyKing is a lightweight survey platform with a conjoint module supporting CBC designs, respondent-level utility calculations, and market-share simulations.
For teams that need basic conjoint capability without the price tag or learning curve of a specialist platform, it covers the core workflow.
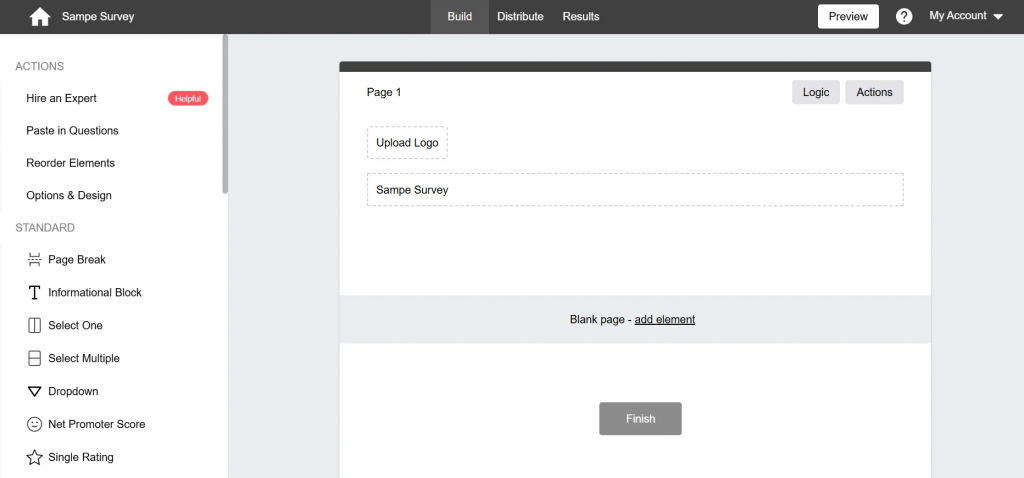
You define your attributes and levels, the platform builds the fractional factorial design, you field to your own respondents, and review utilities and preference shares in the results dashboard. It is a clean, low-friction entry point.
It will not replace Sawtooth for rigorous studies. There is no ACBC, no HB estimation, and no methodology credibility for academic or board-level defense. For a one-off pricing validation, it is more than enough.
Pros:
- CBC module with respondent-level utilities and market simulation at an accessible price point
- Simple setup with no statistical expertise required for basic studies
- Good entry point for teams piloting conjoint research before investing in a specialist platform
- Integrates into a broader survey tool for teams needing mixed-method instruments
Cons:
- Limited advanced methodology: no ACBC, HB estimation, or academic-grade analysis features
- Smaller user community and less documentation than established platforms
- Not appropriate for studies that require statistical rigor or methodology defense
User Rating: Not listed on Capterra
Pricing: From $19/month
My Top 3 Picks Across the Best Conjoint Analysis Software
After reviewing every tool on this list, these are the three I’d reach for first, each for a distinct job.
1. Qualaroo: For the Qualitative Layer, Before and After Conjoint
tells you what customers prefer. Qualaroo tells you why.
If your conjoint output shows that customers prefer the lower tier, a Nudge™ survey on your pricing page tells you whether that is because the higher tier’s value is unclear, the feature gap is not visible, or the price jump feels arbitrary.
That context is what turns a utility score into a decision.
2. Conjointly: For Teams That Need a Full-Service CBC Platform Without Statistical Expertise
Conjointly handles the experimental design, analysis, and reporting in one browser-based environment.
If you need to run a pricing study or feature trade-off with minimal setup and stakeholder-ready output, this is the fastest path from research question to answer.
3. Sawtooth Discover: For Teams Running Rigorous, Repeatable Conjoint Programs
Sawtooth is the academic gold standard for a reason. If you need hierarchical Bayes estimation, adaptive CBC, or methodology credibility for a board presentation or published research, nothing else comes close. Custom pricing is only hard to justify if you run studies infrequently.
These three work as a system. Qualaroo surfaces the qualitative signals that define your conjoint attributes and explain your results.
Conjointly or Sawtooth quantifies the preference data. Together, they cover the full decision intelligence loop: discovery, quantification, and explanation.
How Did I Evaluate These Tools?
1. Conjoint Methodology Depth: I evaluated which methods each tool supports: CBC, ACBC, ACA, MaxDiff, and whether HB estimation is available. For most mid-market product teams, CBC with market simulation is the minimum viable spec. For research-grade programs, HB estimation matters significantly.
2. Ease of Use for Non-Statisticians: Conjoint is technically a specialist method. I assessed how much statistical knowledge is required to set up an experimental design, interpret utility scores, and build a market simulation scenario. Tools that automate the design and produce self-explanatory output score higher for non-specialist teams.
3. Output Quality and Reporting: A utility score table in a CSV file is not the same as a market simulator that your pricing committee can interact with. I evaluated whether each tool produces output that is usable by non-researchers, whether the market simulator is accurate and flexible, and whether reporting can be shared without additional reformatting.
4. Capterra Review Signal: I used Capterra reviews as a proxy for user satisfaction and real-world usability because Capterra’s verification process filters out anonymous submissions. Where Capterra ratings exist, they reflect genuine experiences from product managers, researchers, and analysts who have run actual studies.
5. Pricing Relative to Study Frequency: Conjoint tools range from $19/month to custom enterprise pricing. I evaluated cost against the likely study frequency. A platform priced for dedicated research teams is appropriate for quarterly programs; it is hard to justify for one annual study.
6. Integration With Qualitative Feedback Tools: Because conjoint gives you what, but not why, I evaluated how well each platform integrates or complements qualitative feedback workflows. The highest-value conjoint programs pair statistical preference data with in-context behavioral feedback.
FREE. All Features. FOREVER!
Try our Forever FREE account with all premium features!
How Do I Choose the Right Conjoint Analysis Software?
The most common mistake is picking a conjoint analysis software based on feature lists rather than research intent.
A platform that supports hierarchical Bayes estimation is impressive on paper but irrelevant if your team cannot interpret the output or does not run studies frequently enough to justify the cost.
Start with the decision you are trying to make, then work backwards to the method and conjoint analysis software that fits it.
Use-Case Decision Table
| If Your Primary Need Is | What You Need | Where to Look First |
| Explaining Why Your Conjoint Output Looks the Way It Does | In-context qualitative feedback, behavioral data | Qualaroo |
| Running a Pricing Study Without Statistical Expertise | Self-serve CBC with automated reporting | Conjointly |
| Rigorous, Publication-Quality Conjoint Research | HB estimation, ACBC, academic methodology | Sawtooth Discover |
| Embedding Conjoint Inside a Broader Survey Instrument | Full-suite platform with CBC module | QuestionPro Research Suite |
| Presenting Conjoint Results to Clients or Executives | Automated, branded conjoint dashboards | Displayr |
| Prioritizing Stakeholder Criteria, Not Modeling a Market | Adaptive pairwise trade-off method | 1000minds |
| Running a Simple CBC Study on a Tight Budget | Lightweight conjoint module | SurveyKing |
Evaluation Framework
| Criterion | What to Look For | Why It Matters |
| Methodology Fit | Does it support the conjoint type your research requires (CBC, ACBC, MaxDiff)? | Using the wrong method produces valid-looking but strategically misleading results |
| HB Estimation Availability | Is hierarchical Bayes modeling included or available as an add-on? | Aggregate utilities hide segment differences; HB reveals individual-level preference variation |
| Market Simulator Quality | Can you model “what if” scenarios interactively? | Part-worth utilities alone do not answer business questions; simulation does |
| Team Skill Level Required | Can a non-statistician run the study from setup to output? | High learning curves lead to incorrect experimental designs and biased results |
| Pricing Model | Per-seat annual license vs. per-study vs. per-respondent? | Per-respondent costs compound quickly on large panels; annual licenses reward frequent use |
| Qualitative Integration | Does the conjoint analysis software complement a behavioral or in-context feedback layer? | Conjoint quantifies preference; qualitative feedback explains it |
What Features Should I Look for in Conjoint Analysis Software?
For Product Managers and CX Leads
- Choice-based conjoint (CBC) support with at least 4 to 6 attributes and multiple levels per attribute
- Market simulator that models preference share across custom product configurations
- Drag-and-drop study builder that handles experimental design without manual fractional factorial calculation
- Automated reporting output that non-statisticians can read and act on
- Ability to segment utility scores by customer group, geography, or purchase intent
For UX Researchers and Research Managers
- Adaptive CBC (ACBC) option for studies with many attributes or complex products
- Hierarchical Bayes (HB) estimation for individual-level preference modeling
- Customizable question logic, randomization, and exclusion rules for clean experimental design
- Export to SPSS, R, or CSV for additional statistical processing
- Respondent quality controls: speedster detection, straight-liner flagging, and attention check questions
For Agencies and Research Teams Presenting to Clients
- Brandable, shareable reports and dashboards that do not require reformatting after export
- Market simulator that clients can interact with directly to test their own scenarios
- Multi-project management and team collaboration features
- Support for multiple conjoint methods (CBC, MaxDiff, Van Westendorp) in one platform
For All Teams: What Conjoint Cannot Do Alone
- Explain why a utility score looks the way it does
- Capture in-the-moment hesitation, confusion, or motivation
- Tell you which attributes you should have included but did not
- Segment feedback by real user identity, plan type, or behavioral history
This is where Qualaroo adds its value. When you know a pricing tier underperforms in your conjoint simulator but cannot explain why, a Nudge™ survey triggered on that tier’s landing page will.
The Identify API maps every response to a real user, so you can push targeted follow-ups to the exact segment your conjoint flagged, and AI Sentiment Analysis surfaces the pattern across hundreds of open-text answers without manual review.
Which Conjoint Analysis Software Should You Start With?
If you are a product manager or CX lead trying to make a pricing or roadmap call, the conjoint analysis software choice comes down to two things: how rigorous your study needs to be, and what you plan to do with the output once you have it.
Conjoint will tell you what customers prefer. It will not tell you why the numbers look the way they do, which attributes you should have tested but did not, or where in your product experience the preference gap is actually forming.
That is the layer most teams skip, and it is where good conjoint data goes to die in a spreadsheet.
Qualaroo closes that gap. Nudge™ surveys placed at key decision points before your study surface the real drivers behind user choices.
After the study, behavioral targeting, Session Recordings, and AI Sentiment Analysis give you the context that turns a utility score into a decision your whole team can act on.
Frequently Asked Questions
What is conjoint analysis software?
Conjoint analysis software is a research tool that designs, fields, and analyzes trade-off studies to measure how customers value different product attributes, prices, and features. Instead of asking what customers want, it presents complete product options and measures what they choose. The output, called part-worth utilities, quantifies the contribution of each attribute level to overall preference, enabling product and pricing decisions grounded in statistical evidence rather than stated opinion.
What is choice-based conjoint analysis, and how does it work?
Choice-based conjoint (CBC) presents respondents with sets of complete product profiles, each built from a different combination of attribute levels, and asks them to select the option they would purchase. The platform generates a fractional factorial design to cover all key combinations without requiring every respondent to evaluate every permutation. Statistical modeling then derives part-worth utilities from the pattern of choices, revealing which attributes drive decisions and how much each price level costs in preference share.
What is the difference between conjoint analysis and asking customers directly what they want?
Direct questions produce aspirational answers. Ask customers if speed matters, and nearly everyone says yes. Conjoint forces realistic trade-offs: a respondent who says they want unlimited storage and the lowest price has to choose between them when options are presented as a set. That forced choice reveals true priorities, including willingness to accept limitations that direct questions would never surface. This is why conjoint data is a stronger input to pricing and feature decisions than rated importance surveys.
Do I need a statistician to run conjoint analysis?
Not for most modern platforms. Tools like Conjointly and SurveyKing automate the experimental design, analysis, and reporting. You need to understand your research question well enough to define the right attributes and levels; the platform handles the rest. For studies requiring hierarchical Bayes estimation, ACBC, or methodology defense in a publication or litigation context, working with a researcher is advisable.
What sample size do I need for conjoint analysis?
For choice-based conjoint with three to six attributes, 150 to 300 complete responses typically produce reliable aggregate-level utility estimates. If you need segment-level analysis or individual-level estimates via hierarchical Bayes, target 200 to 400 respondents. Underpowered samples produce unstable utility scores that shift significantly with small data changes.
What response rates should I expect for a conjoint survey?
As per the Conjointly data, survey open rates typically vary between 5-15%, with survey completion rates typically under 1%. In-context or in-app surveys, where the survey appears while users are actively engaged with the product, generate significantly higher completion rates. Qualaroo's Nudge™ format captures feedback at the moment of highest engagement, producing response quality that is up to 10x more valuable than post-session email surveys.
What is a part-worth utility in conjoint analysis?
A part-worth utility is a numerical score representing how much a specific attribute level contributes to overall preference. Higher utility means stronger preference contribution. These scores are additive: you estimate preference for any product configuration by summing the part-worth utilities for each of its attribute levels. Relative importance across attributes is calculated by the range of utilities within each attribute divided by the total range across all attributes.
Can conjoint analysis replace qualitative research?
No, and the most common mistake in conjoint programs is treating it as if it can. Conjoint quantifies trade-off behavior but does not explain it. A utility score showing that customers prefer the lower price tier does not tell you whether that preference is driven by feature confusion, price anchoring from a competitor, or a genuine value gap. You need qualitative feedback, either exploratory interviews before the study or in-context surveys after, to make the data actionable. Pairing conjoint with Qualaroo's Nudge™ surveys covers both layers efficiently.
What is the best conjoint analysis software for a product manager with no research background?
For teams without a dedicated research function, Conjointly offers the most accessible path from research question to output. It automates the experimental design, generates an analysis-ready report, and includes a market simulator with no statistical configuration required. For teams that also need to explain or validate their conjoint output with real user feedback, Qualaroo fills the qualitative gap that Conjointly leaves open.
FREE. All Features. FOREVER!
Try our Forever FREE account with all premium features!
 We'd love your feedback!
What did you like & how can we make it even better?
 Thanks for your feedback!
 Ask Your Question
Have a question? Get expert help to make your decision easier.