
NPS in product management is the practice of using Net Promoter Score data, not just to report customer sentiment, but to drive specific decisions: which features to fix, which users to rescue, and where the product is losing people it should be keeping.
Most product teams collect NPS. Very few know what to do with it once it arrives. The problem is not the metric. It is how product managers use it: as a number to report upward instead of a signal to act on.
You’ll leave with a 6-step workflow, a ready-to-use branching question set, and the segmentation logic that separates teams who improve from teams who just track a number.
What Is NPS in Product Management?
NPS (Net Promoter Score) in product management is a customer loyalty metric that measures how likely users are to recommend your product to others. Product teams use it to gauge satisfaction, identify friction, and surface the feedback needed to prioritize features and reduce churn. Scores range from -100 to +100.
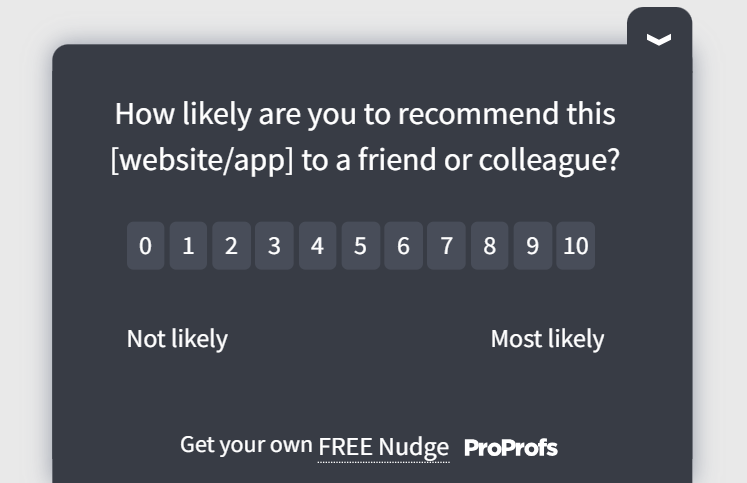
The NPS survey begins with a single question: “On a scale of 0 to 10, how likely are you to recommend [product name] to a friend or colleague?”
Respondents fall into three groups:
- Promoters (9-10): Loyal users who see clear value and are likely to refer others.
- Passives (7-8): Satisfied but not enthusiastic. At risk of switching if a better option appears.
- Detractors (0-6): Unhappy users who may actively discourage others from using the product.
The score is calculated by subtracting the percentage of detractors from the percentage of promoters. Passives are excluded from the formula.
Example: If 40% of respondents are promoters and 15% are detractors, your NPS is 25.
What makes NPS relevant for product managers specifically is the follow-up. The number is the signal. The open-text response that follows is the intelligence.
One caution here. NPS is a fast, recurring pulse on sentiment, not a replacement for discovery research, usability testing, or product analytics. Treat it as one input that tells you where to look closer, not the final word on what to build or fix.
How to Use NPS as a Product Manager: A Step-by-Step Framework
Most product teams treat NPS as a reporting exercise. They collect the score, share it in a meeting, and wait for the next cycle. Nothing changes because no one owns the next step.
This NPS framework takes you from deciding what to measure to closing the loop, with a clear action at every stage.
Step 1: Define What You Are Measuring Before Launching Anything
Decide upfront whether you are running transactional NPS (triggered after a specific event: onboarding, a feature release, a support resolution) or relationship NPS (quarterly, measuring overall product health).
They produce different data. Running both without labeling them will make your trend charts lie to you.
Step 2: Deploy the Survey at the Right Moment for the Right Users
Timing determines data quality. Send too early, and users have nothing to reflect on. Send too late, and they have already moved on.
| User Segment | Trigger Timing |
| New users | After the first meaningful action, not the signup day |
| Active users | After 30 days of consistent usage |
| Power users | Quarterly relationship NPS |
| After a feature release | 7 to 14 days post-release |
| After support resolution | 24 to 48 hours post-ticket close |
| Exit intent | Immediately on the exit signal |
In-product surveys capture how users feel while they are engaged. Email surveys ask them to recall a feeling days later. The response quality gap is significant.
Step 3: Build Branching Follow-Up Questions by Score Group
The NPS question is the same for everyone. Everything after it should not be. Two follow-up questions per group is the ceiling. Every additional question drops the completion rate.
Copy and use this set directly:
Core Question: “On a scale of 0 to 10, how likely are you to recommend [product name] to a friend or colleague?”
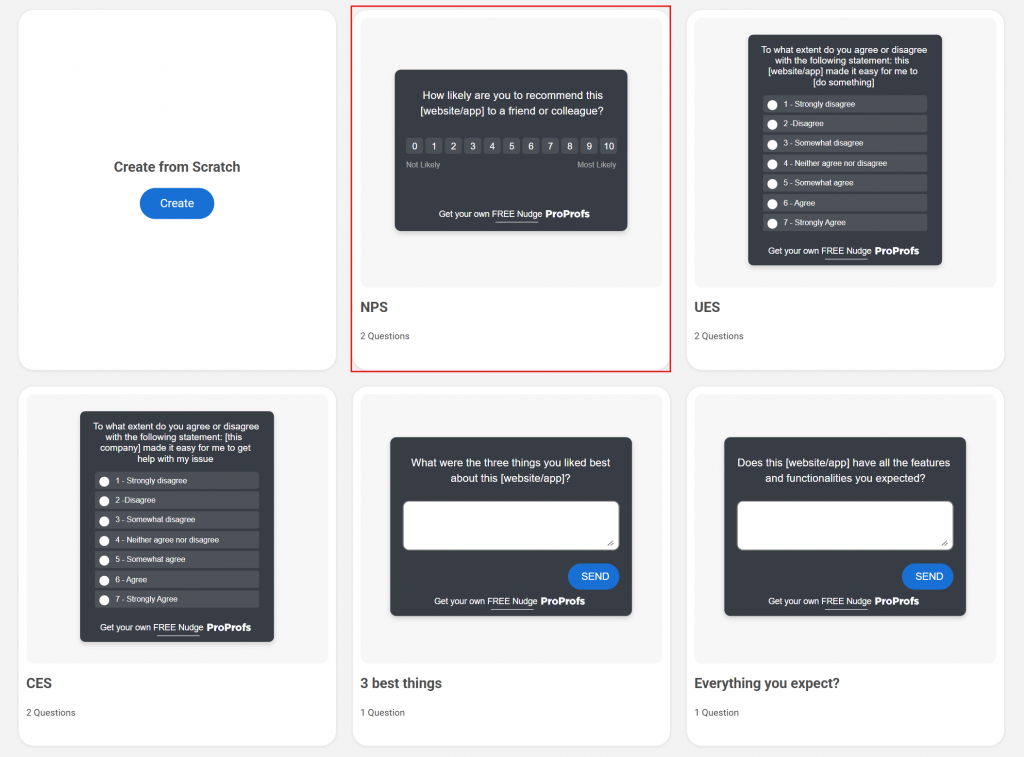
Here’s an NPS template you can use:
For Promoters (9-10): What’s the single biggest reason you’d recommend us? / Which feature do you rely on most?
For Passives (7-8): What would need to change for you to give us a 9 or 10? / Where in your workflow does the product fall short today?
For Detractors (0-6): What went wrong? Be specific. What’s the main reason you wouldn’t recommend us today?
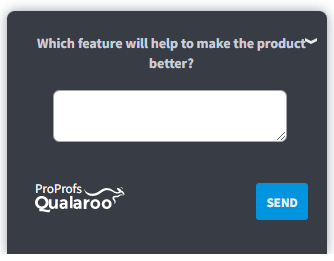
Framing Note: Ask about problems and reasons, not proposed fixes. A question like “What feature should we build?” turns the customer into a solution designer and skews your roadmap toward whoever asked loudest. Your job is to diagnose the friction, then decide to fix it yourself.
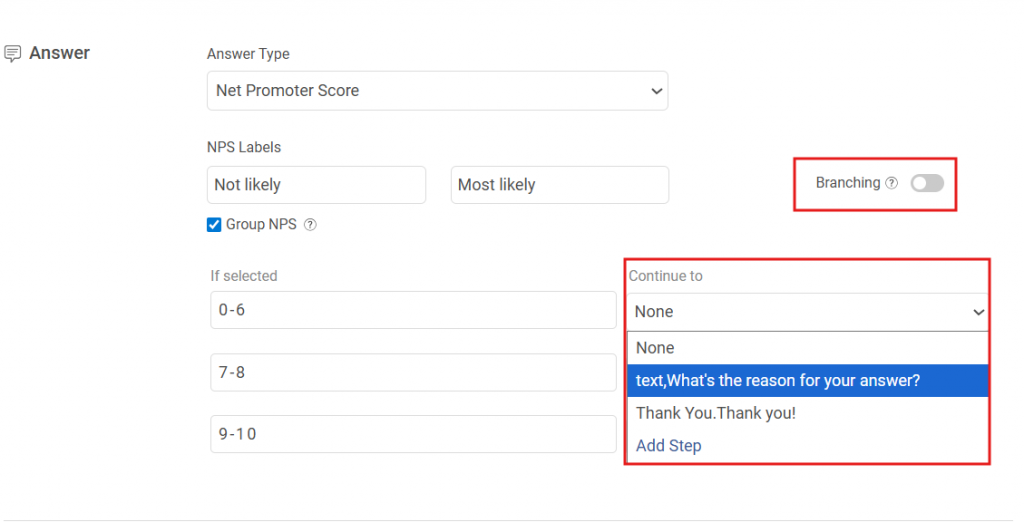
Here’s how you can set branching logic:
Step 4: Tag and Score Responses by Product Area
Do not react to individual responses. Find the pattern first.
Tag every open-text response to a product area: onboarding, core feature, performance, billing, support, or missing feature.
Then calculate a per-category NPS score.
Sort from lowest to highest, but don’t act on the lowest score alone.
Weigh it against sample size (a category with eight responses can swing wildly), frequency, severity, the segment it affects, revenue impact, your confidence in the pattern, and the effort a fix would take.
A low score from a thin, low-value sample is a hypothesis to watch, not a mandate to build.
Step 5: Segment by User Attribute Before Drawing Any Conclusion
An aggregate NPS score is a starting point, not a finding. Split it before you interpret it.
- By Plan Tier: High free-tier detractors point to an onboarding gap. High-paid-tier detractors point to a value-delivery gap.
- By Role: A PM and a developer using the same product may experience it completely differently.
- By Cohort: Users who joined before a major update often score it differently than those who joined after.
- By Usage Depth: Power users and casual users have different satisfaction thresholds. Do not average them.
Once you know which segment scores low, pull session recordings from that cohort to see exactly where they hesitate, rage-click, or drop off.
The NPS tells you who is unhappy. The recordings show you what is breaking.
One Guardrail: Once you’re linking survey scores to session recordings and identity data, you’re handling personal behavioral data, not just aggregate sentiment. Make sure recordings mask sensitive fields, your privacy policy discloses this use, and access to identified data is limited to people who need it for this analysis.
Step 6: Close the Loop With Every Respondent
Respond to detractors personally. Notify promoters when a feature they asked for ships. Route feedback themes to the team that owns them.
CustomerGauge (2023) found that closing the loop with all customers increases retention by 8.5%. That is not a rounding error. It is a meaningful impact on ARR for any SaaS product.
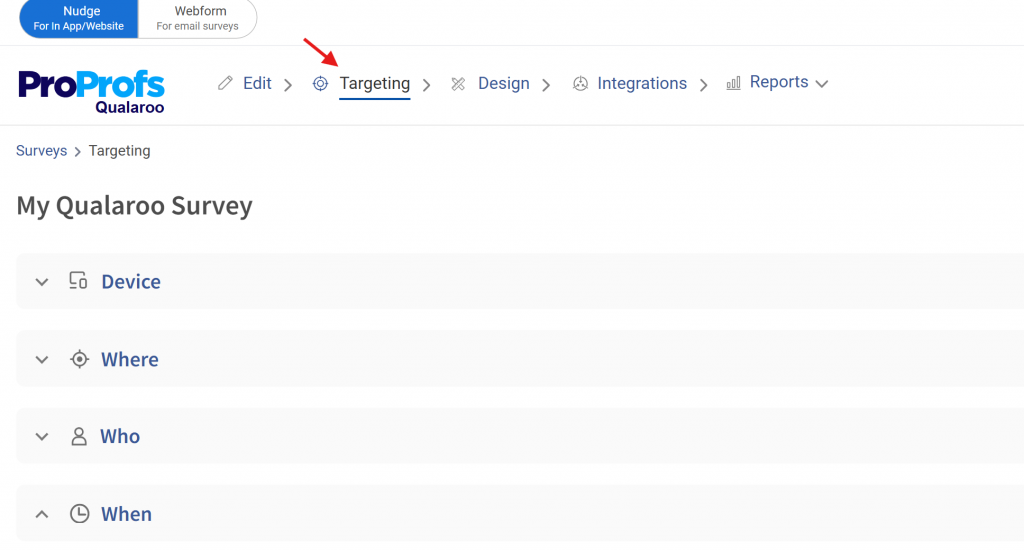
How to Set This Up in Qualaroo
Qualaroo handles the entire workflow without needing a developer after the initial install. Here is what each step maps to:
- Survey Type and Design: Start from the NPS template. The core question is pre-built. Match the Nudge to your brand colors and logo in the settings panel.
- Branching: Set score-based routing in the survey builder. Promoters, passives, and detractors each get their own follow-up path automatically.
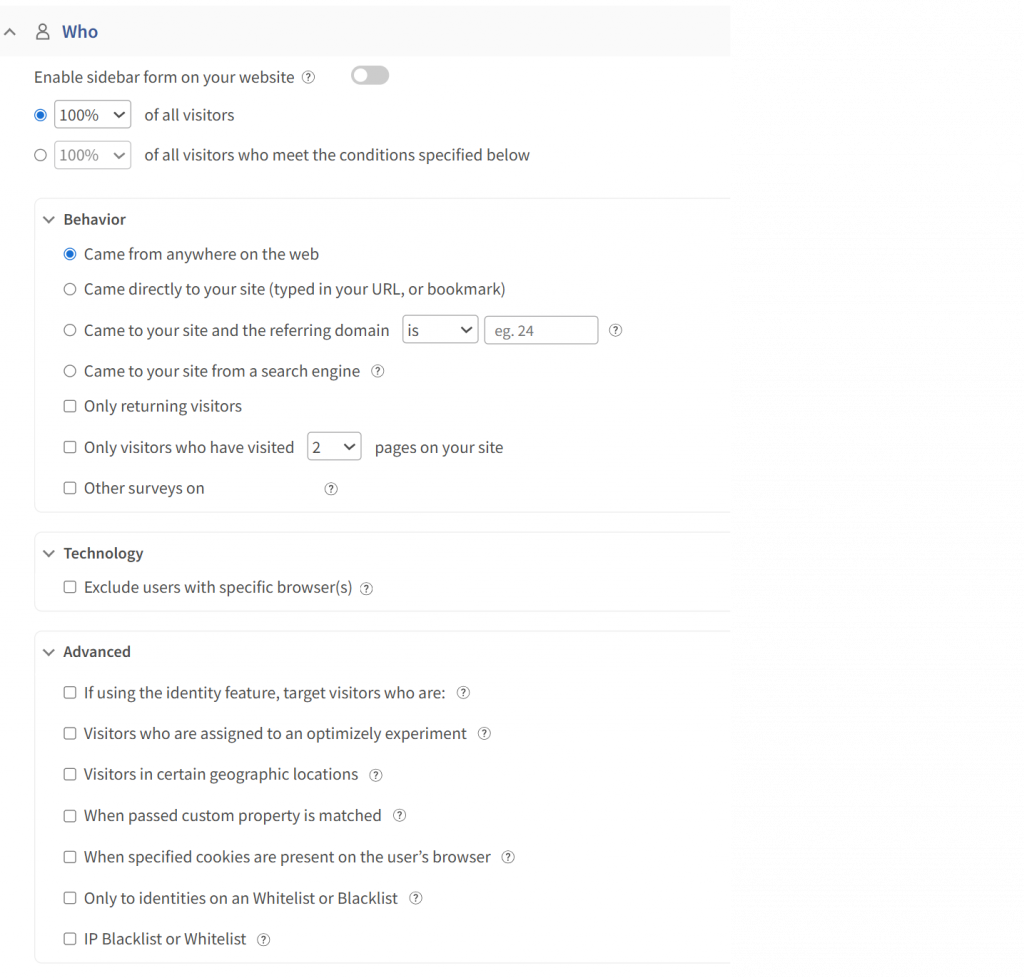
- Targeting: Set the trigger URL to fire only inside the app, define session-depth conditions (at least 14 days active, at least one key action completed), and apply a 90-day suppression window per user.
- Analysis: AI Sentiment Analysis auto-categorizes open-text responses by sentiment and surfaces recurring themes, replacing manual tagging. Here’s how:
- Segmentation: The Identity API links every response to a specific user by email or customer ID, so you can filter NPS data by plan, role, or any CRM attribute without leaving the dashboard. Since this ties feedback directly to an identified user, make sure your consent language and data retention settings account for it, particularly if you’re also pulling in session recordings for the same account.
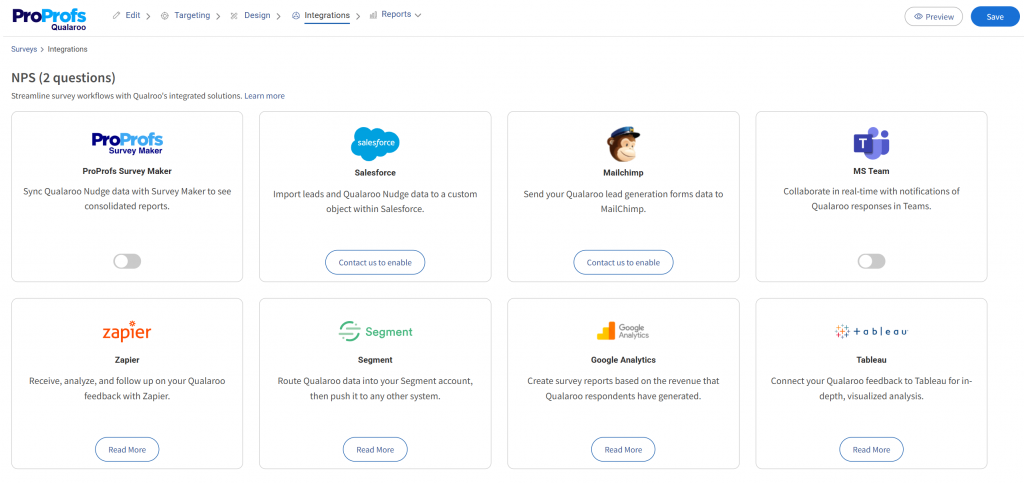
- Closing the Loop: Route responses to Slack in real time, push scores into Salesforce or HubSpot, or trigger a Zapier workflow the moment a detractor score is submitted.
Belron, one of the largest windshield replacement companies in the world, applies this across both digital and in-store touchpoints.

The team triggers NPS surveys at distinct journey stages, including specifically targeting visitors who bounce without converting, to capture friction signals before they become churn.
The result: a sustained NPS above 80, maintained through continuous in-context feedback rather than periodic email surveys.
What Is a Good NPS Score for a SaaS Product?
NPS benchmarks vary by industry. Use this as a starting reference before deciding whether your score needs urgent attention:
| Industry | Average NPS | Strong NPS |
| SaaS / Software | 36 | 50+ |
| E-commerce | 40–55 | 65+ |
| Financial Services | 44 | 55+ |
| Healthcare | 58 | 70+ |
| Professional Services | ~45–55 | 65+ |
Source: CustomerGauge 2025 Benchmarks
An NPS above 0 means more promoters than detractors. Above 30 is competitive for most SaaS products. Above 50 is excellent. Benchmark within your vertical, not against unrelated industries.
Why Do Product Managers Use NPS?
Product managers are responsible for decisions that are hard to validate without user data: which features to build, which bugs to prioritize, and which parts of the onboarding experience to fix.
NPS gives them a recurring, structured way to hear from users in their own words.
Here is what experienced product managers actually use it for:
NPS as a Product-Market Fit Signal
A high NPS often correlates with strong product-market fit. When users score 9 or 10, they are saying the product solves a real problem well enough to stake their reputation on recommending it.
According to Bain & Company (2023), NPS scores account for roughly 20% to 60% of the variation in organic growth rates among competitors.
Industry NPS leaders outgrow their competitors by more than 2x on average.
Conversely, a cluster of detractor scores is an early warning that something in the product is not delivering. The problem might be onboarding, a specific feature, performance, or pricing. The NPS surfaces the existence of the problem. The open-text and branching questions reveal where it lives.
NPS as a Feature Prioritization Framework
When hundreds of NPS responses arrive, the instinct is to read the most negative ones and react. That is the wrong approach.
The right one is to categorize every open-text response by product area (onboarding, core feature, performance, billing, support), then calculate a separate NPS score for each category.
This approach turns NPS from a company health metric into one input for feature prioritization. Weigh it alongside usability findings, support ticket volume, and revenue impact before it earns a roadmap slot.
NPS and Churn: What the Data Actually Shows
NPS alone is not a reliable predictor of renewal. Recent Gartner research (2025) reinforces that NPS remains limited as a standalone churn predictor.
While it can signal broader loyalty trends, companies should treat it as one diagnostic input among many.
Predictive models that layer NPS with usage data often fail to move net retention numbers without strong intervention capabilities.
Focus on turning insights into fast action, and pair sentiment metrics with behavioral analytics and effort-based measures for better retention outcomes.
Where NPS does predict meaningful business outcomes is in expansion revenue.
The practical takeaway: do not use NPS as your churn prediction model. Use it as a product health diagnostic, and pair it with product analytics to identify accounts at risk.
FREE. All Features. FOREVER!
Try our Forever FREE account with all premium features!
Start Running NPS That Actually Informs Product Decisions
The gap between product teams that improve with NPS and those that just track it comes down to one thing: workflow.
If NPS responses flow into a spreadsheet nobody reads, the metric is decorative. If they flow into a categorized, segmented, closed-loop system, the metric becomes a product decision engine.
Qualaroo lets product teams run in-product NPS surveys with advanced targeting, branching follow-ups, AI Sentiment Analysis, and Session Recordings, so you can go from score to action without losing signal in the process.
There is a forever-free plan with all features included, so you can run your first in-product NPS survey today without a credit card.
Frequently Asked Questions
What does NPS stand for in product management?
NPS stands for Net Promoter Score. In product management, it refers to the loyalty metric collected from product users by asking how likely they are to recommend the product to a colleague. The score is calculated as the percentage of promoters (9-10) minus the percentage of detractors (0-6).
What is a good NPS score for a SaaS product?
Any score above 0 means you have more promoters than detractors. Scores above 30 are generally considered good for SaaS products. Scores above 50 are excellent. Context matters: benchmark against your industry rather than comparing to NPS scores from unrelated sectors.
How often should product managers run NPS surveys?
For relationship NPS (overall product health), run it quarterly. For transactional NPS (post-feature, post-onboarding, post-support), trigger it based on user actions rather than calendar dates. Avoid surveying the same user more than once every 90 days.
What is the difference between transactional and relationship NPS in product management?
Transactional NPS is triggered after a specific event (feature launch, support resolution, onboarding completion) and reflects a localized experience. Relationship NPS measures overall product loyalty over time. Both are useful. They cannot be compared to each other, and they should not be averaged together.
How do product managers segment NPS data?
The most useful segmentation dimensions for product teams are: plan tier (free vs. paid), user role, account size, cohort (signup date relative to a product update), and usage depth (power users vs. casual users). Aggregate NPS hides the real signal. Segment first, then interpret.
What follow-up questions should product managers ask after the NPS score?
Use branching logic to show different questions based on the score. Promoters should be asked what they love most and what they would build next. Passives should be asked what is holding them back from a 9 or 10. Detractors should be asked specifically what went wrong and what would need to change. Generic follow-ups sent to all groups produce weaker insights.
What is the best way to collect product NPS surveys?
In-product surveys outperform email surveys for product teams because they capture feedback while the user is engaged with the product. Email surveys rely on recall and typically have lower response rates and less contextually accurate responses. Tools that support in-app Nudge surveys, advanced targeting, and real-time segmentation give product teams the most actionable data.
FREE. All Features. FOREVER!
Try our Forever FREE account with all premium features!
 We'd love your feedback!
What did you like & how can we make it even better?
 Thanks for your feedback!
 Ask Your Question
Have a question? Get expert help to make your decision easier.