

Your NPS survey response rate is the number that determines whether your NPS score is worth acting on, or just a number on a dashboard.
Most teams send the survey, watch the score, and move on. What they don’t check is whether the people who responded actually represent their customers.
If your response rate is sitting below 15%, there’s a real chance your score is misleading you.
The first people to complete any NPS survey are almost always your loudest promoters and your most frustrated detractors.
The passive majority, the customers who feel fine but are quietly at risk, tend not to respond at all.
This guide covers what a good rate looks like by channel and industry, how to raise it fast, how to build an NPS survey in Qualaroo, and what to do when it stays stubbornly low.
What Is NPS Survey Response Rate?
NPS survey response rate is the percentage of people who complete your survey out of the total number who received it.
Formula: (Number of Completed Responses / Total Surveys Sent) x 100. A 20% response rate means 20 out of every 100 recipients completed the survey.
Response rate and NPS score measure two different things. Your NPS score measures customer loyalty. Your response rate measures whether you are hearing from enough customers to trust that score.
A low response rate doesn’t just give you a smaller sample. It gives you a biased one. When only a fraction of your base responds, the data skews toward extremes: vocal promoters and actively unhappy detractors.
The silent majority, your at-risk passives, opts out. Research from User Intuition (2026) confirms that non-respondents skew disproportionately toward passives and mild detractors, meaning your NPS can look healthy right up until accounts start churning.
What Is a Good NPS Survey Response Rate?
There is no universal answer. The benchmark depends almost entirely on which channel you use. Judging your email NPS response rate against SMS benchmarks will always produce a misleading picture.
| Survey Channel | Average NPS Response Rate | Strong Rate |
| Email (Embedded Questions) | 10-20% | 20%+ |
| Email (Link to External Survey) | 6-15% | 20%+ |
| SMS | 40-50% | 50%+ |
| In-App Mobile | 15-30% | 30%+ |
| In-App Web App | 10-25% | 25%+ |
| Website Pop-Up (Anonymous) | 5-10% | 10%+ |
| Transactional NPS (All Channels) | 20-40% | 40%+ |
| Relational NPS (All Channels) | 10-25% | 30%+ |
Sources: Bain & Company NPS methodology and reliability guidance; CustomerGauge 2026 B2B NPS Benchmarks Report; general industry survey response rate analyses (2025-2026); SMS marketing performance data; aggregated cross-industry benchmarks from academic and consulting reports.
For B2B email NPS, Bain & Company benchmarks show an average response rate of 12.4%, with a range of 4.5% to 39.3%. In B2B SaaS, reaching 22% on email NPS already puts you ahead of roughly three-quarters of your peers (Clootrack, 2025).
Benchmark against your channel, not a universal number. A 20% rate from email is solid. A 20% rate from SMS is underperforming.
Here are a few NPS statistics you can refer to for increasing customer loyalty and retention.
What Is the Average NPS Survey Response Rate by Industry?
Industry has less impact on response rates than the channel does.
A B2B SaaS company and a healthcare organization using the same email survey format will see broadly similar response rate ranges, even though their actual NPS scores differ significantly.
| Industry | Typical Email NPS Response Rate | Notes |
| B2B SaaS | 15-25% | Product-led triggers and engaged user bases can drive higher rates |
| B2B (Broad) | 4.5-39.3% (avg. ~12%) | Wide variance based on relationship strength and survey design |
| Healthcare | 10-20% | Patient survey fatigue from multiple touchpoints often lowers rates |
| Financial Services | 12-22% | Personalized or advisor-sent surveys tend to outperform generic emails |
| Retail and E-Commerce | 8-18% | Transactional relationships; post-purchase timing is critical |
| Hospitality | 15-25% | Rates drop significantly if not sent soon after the experience |
Sources: Bain & Company NPS methodology and reliability guidance; CustomerGauge State of B2B Account Experience Report; aggregated industry analyses from consulting and marketing performance reports (2025-2026).
The consistent theme across industries: timing and channel selection matter more than the industry itself.
A SaaS company sending NPS via in-app immediately after a key product interaction will outperform the same company sending a linked email survey three days later, in every vertical.
How Can You Improve Your NPS Survey Response Rate?
A higher NPS survey response rate means more representative data, fewer blind spots in your customer base, and a score you can actually act on.
The fixes aren’t complicated, but they have to happen in the right order: channel before copy, timing before design, suppression before reminders.
1. Switch to In-App Surveys for Active Users
The most reliable way to raise your response rate is to move the survey closer to the moment the experience happens.
In-app surveys achieve an overall average response rate of 27.52%, with mobile apps reaching 36.14%, as per Refiner’s 2025 report analyzing 1,382 surveys and over 5 million views. Email-linked surveys land at 6-15%.
When someone is actively inside your product, they have context for your question. The ask feels relevant. Responding takes one tap instead of clicking through an email, loading an external page, and filling in fields.
This is the problem that Qualaroo’s Nudge™ technology solves.
Instead of sending a survey to an inbox competing with 50 other emails, a Nudge™ appears non-intrusively in the product at the moment a user completes a meaningful action.
You capture feedback while the experience is live, not a day later when the feeling has faded.
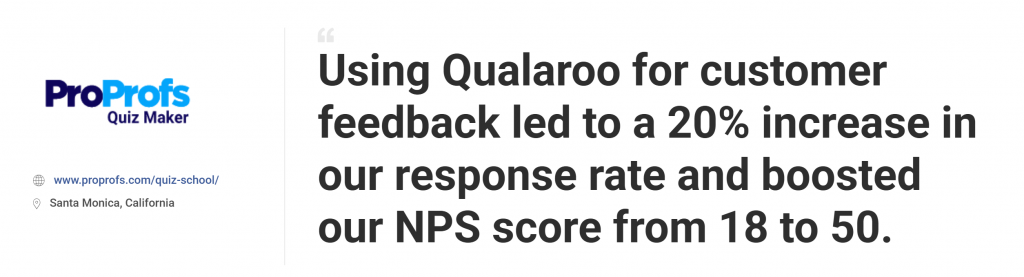
ProProfs Quiz Maker used this approach, boosting their NPS from 18 to 50 while simultaneously increasing response rates by 20%.
2. Trigger After Success Moments, Not Randomly
Trigger NPS after a success moment, not during an active workflow or right after a frustrating interaction.
A user who has just completed onboarding, reached a usage milestone, or resolved a support ticket is in the right mindset to give useful feedback.
For email surveys, Tuesday through Thursday between 10 AM and 2 PM in the recipient’s local time zone consistently produces the best open and completion rates for B2B audiences (DailyStory, 2026).
The best time for in-app surveys is immediately after a user completes a meaningful milestone or task (e.g., finishing a purchase, upvoting a feature, or resolving a support ticket).
According to Refiner’s 2025 study, you should wait about 5 to 15 seconds after an action is completed before prompting the survey. This prevents interrupting the immediate flow of completion.
3. Personalize the Survey Invitation
Generic requests get ignored. Personalized requests that reference the customer’s name and a specific interaction they just had feel like a real ask from a real person.
According to Sopro’s State of Prospecting 2026 report, over 57% of B2B decision-makers state that the majority of sales outreach they receive feels entirely impersonal and irrelevant, creating a significant competitive advantage for highly targeted campaigns.
The bar doesn’t have to be high. Add the recipient’s name, reference the interaction (“Based on your experience with onboarding this week”), and tell them what you do with responses.
One tactic that consistently works: send the survey from a named customer success manager or the CEO’s email, not a generic company account.
4. Keep the Survey to Two Questions Maximum
Every additional question beyond the core NPS question reduces response rate by 5-15% (User Intuition, 2026). The optimal format: one rating question, one conditional follow-up.
Use skip logic to tailor the follow-up to the score:
- Promoters (9-10): “Would you be willing to share your experience in a testimonial?”
- Passives (7-8): “What would make you more likely to recommend us?”
- Detractors (0-6): “What specifically fell short of your expectations?”
Every respondent sees two NPS questions at most, and each follow-up is directly useful for the action you need to take next.
5. Send One Reminder to Non-Responders
Sending a single reminder 3-7 days after the initial survey invitation can boost the response rate by up to 14% (PointerPro, 2024)
One is enough. A second reminder produces diminishing returns and risks accelerating fatigue.
6. Suppress Recently Surveyed Customers
If a customer has responded to any survey in the last 60-90 days, exclude them from the next NPS send.
Survey fatigue is cumulative and applies across all your touchpoints, not just NPS.
For B2B accounts, coordinate across product, marketing, and customer success to make sure the same contact is not receiving multiple survey types within the same 30-day window.
FREE. All Features. FOREVER!
Try our Forever FREE account with all premium features!
How Do You Create an NPS Survey With Qualaroo?
Here’s how to build an in-app NPS survey that captures responses at the right moment, links them to real users, and routes insights where they need to go.
Here are the detailed steps:
Step 1: Log In and Create a New Survey
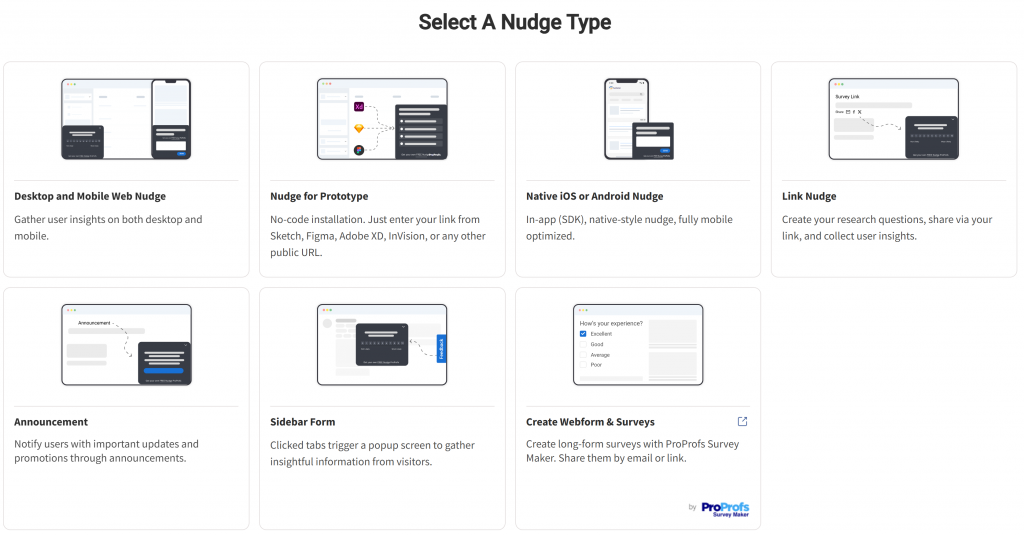
Log in to your Qualaroo account and click “Create a Nudge.” Choose your Channel Type.
Select the “NPS template” from the template menu.
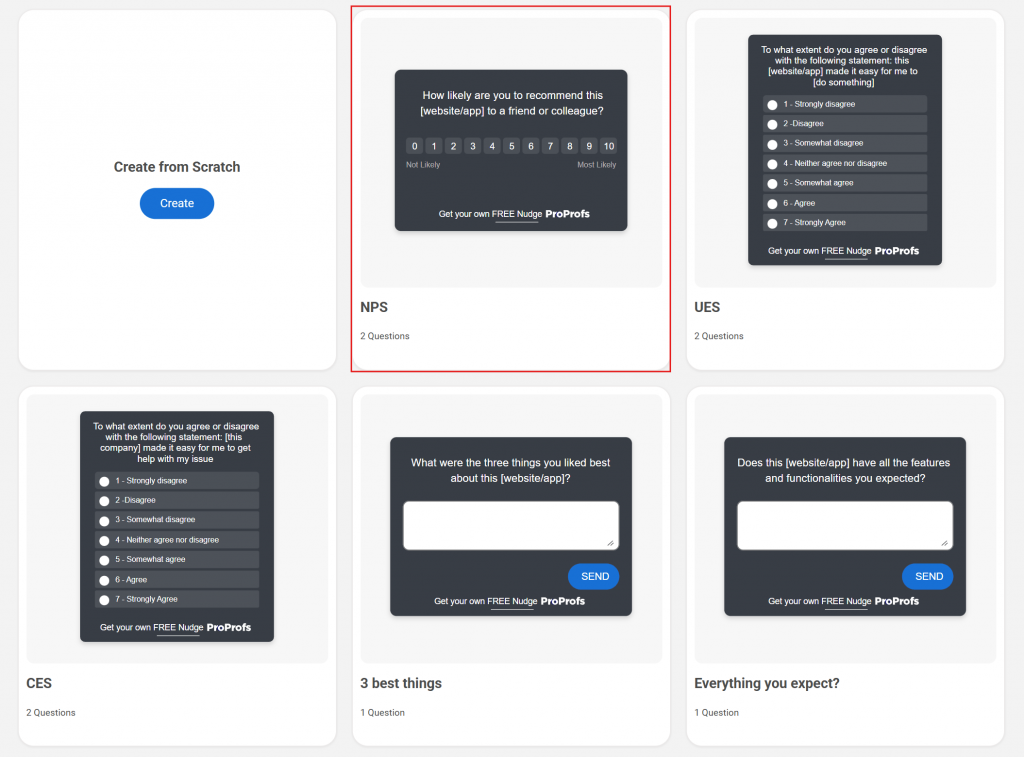
You get the standard 0-10 scale question pre-loaded with the option to customize the phrasing.
You can also create your Nudge using AI:
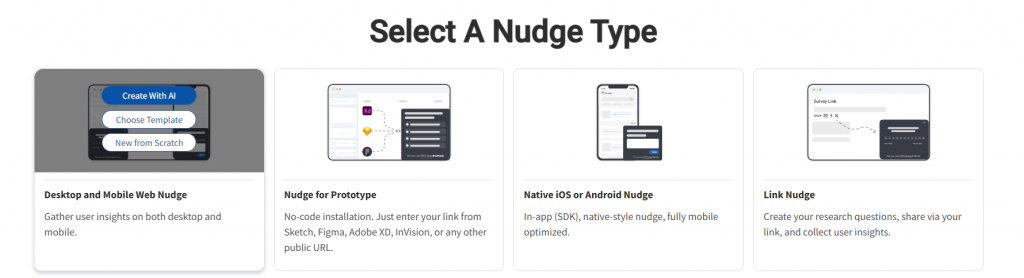
Type what you want the survey to do. Be specific about whom you are surveying, when the survey fires, and what you want to learn.
For example: “Create an NPS survey for B2B SaaS customers after their first 30 days, with conditional follow-up questions for promoters, passives, and detractors.”
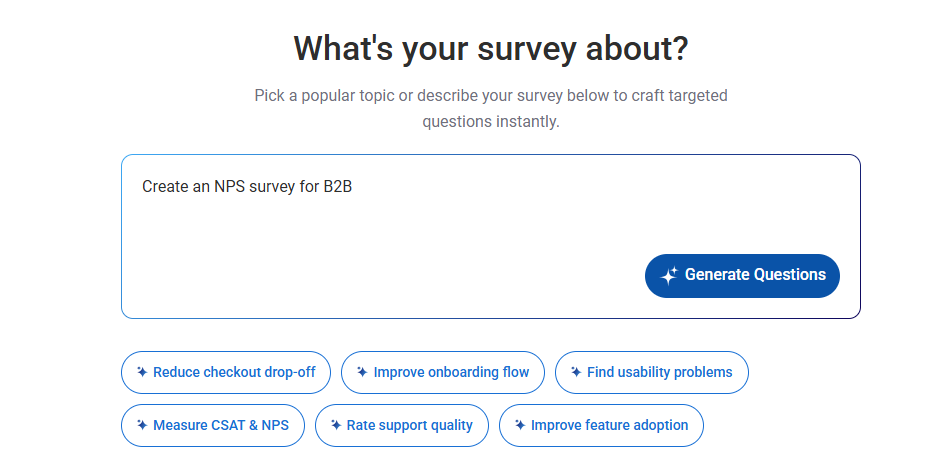
The AI generates a complete survey instantly, including the core 0-10 NPS question, segment-specific follow-ups, and branching logic already configured for each score range.
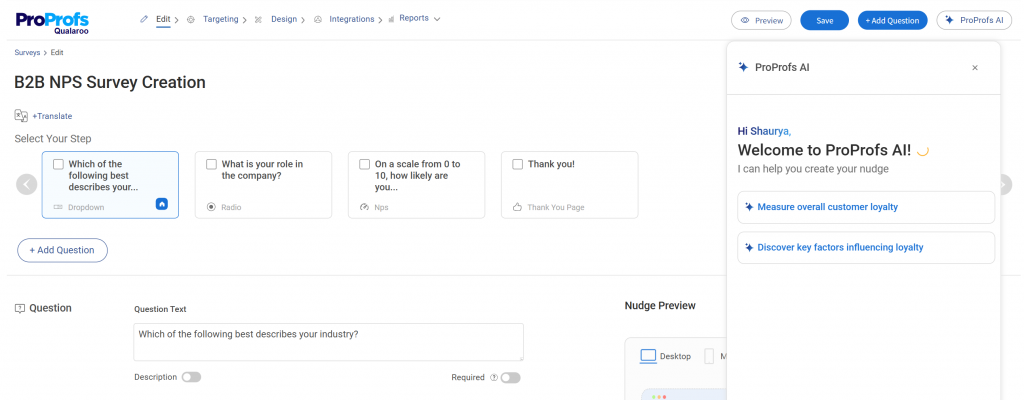
Step 2: Add a Conditional Follow-Up Question
Add a second question and set it to trigger based on the NPS score using Qualaroo’s skip logic.
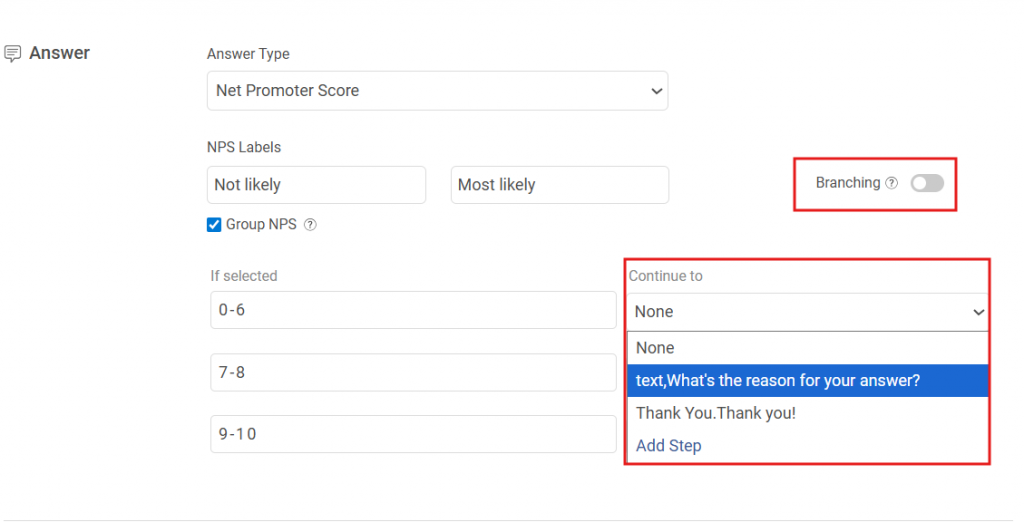
Show promoters a testimonial ask, passives a “what would make you more likely to recommend us” question, and detractors a “what specifically fell short” question.
This keeps the survey to two questions regardless of which path the respondent takes.
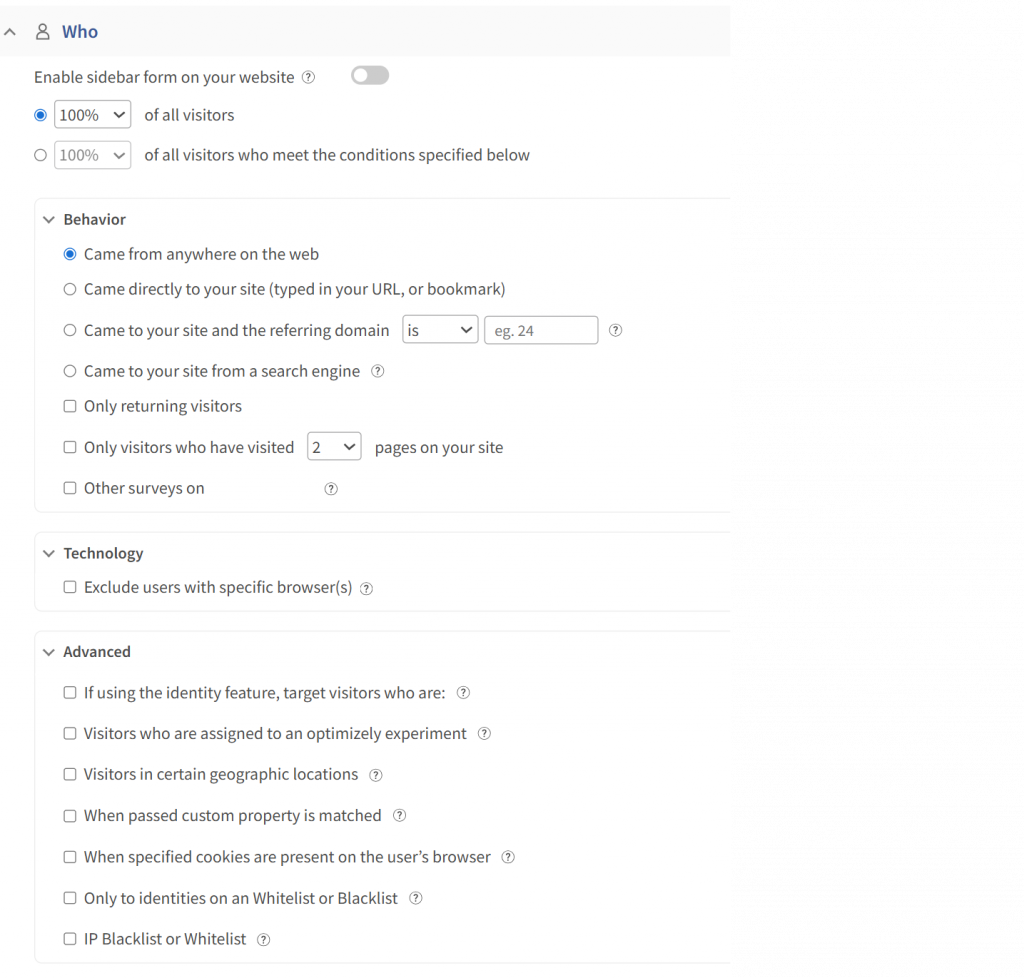
Step 3: Set Your Targeting Rules
Under “Targeting,” set the survey to trigger after a specific in-product event: completing onboarding, reaching a usage milestone, finishing a successful support interaction, or logging in for the fifth time in a month.
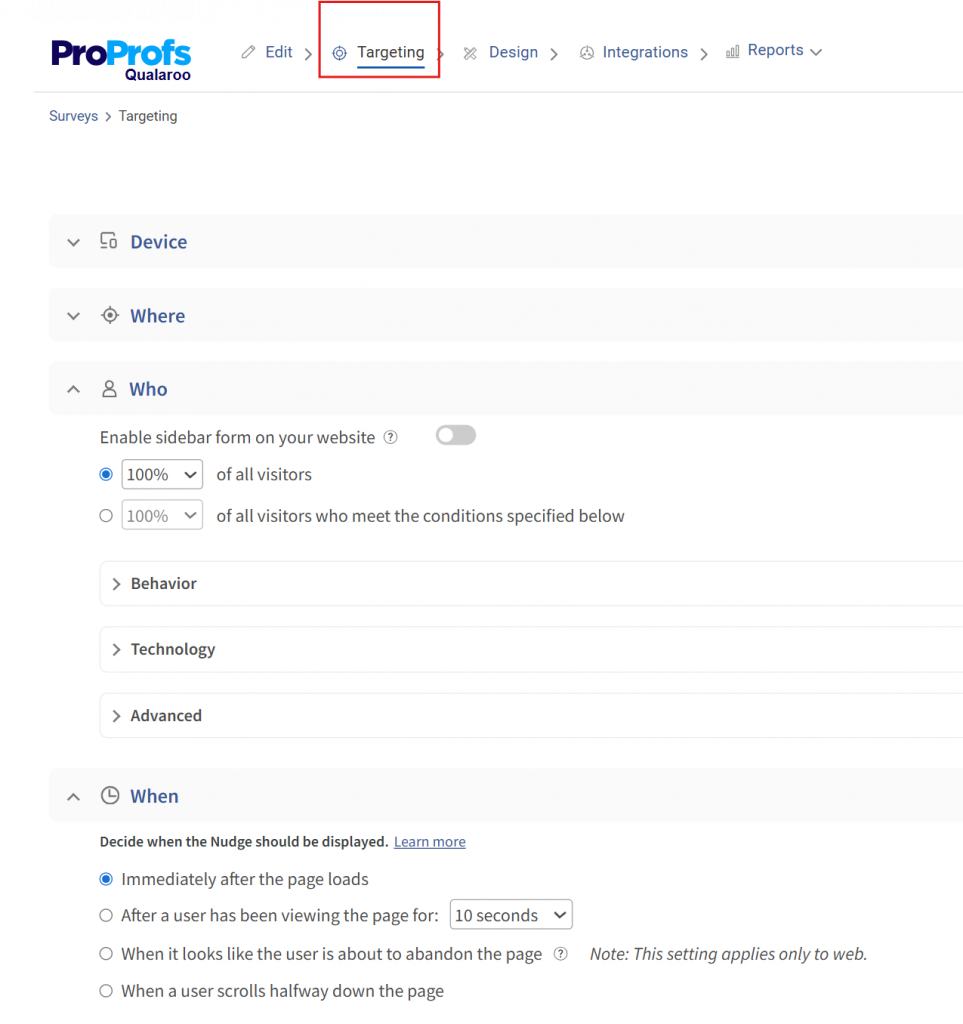
Set a 90-day suppression window so the same user doesn’t see the survey again within that period.
Use Qualaroo’s advanced targeting to exclude users who are active for fewer than seven days (not enough context for meaningful feedback) or free-tier users if your program is focused on paid accounts.
Step 4: Add the Identify API
To link every response to a named user, add one line of JavaScript to your product: _kiq.push([“identify”, “user@email.com”]);.
Replace the email value with the variable from your user session. This is available on all paid Qualaroo plans with no additional tier required.
This matters because anonymous responses are hard to act on. When you know a detractor response came from your highest-value account, your CS team can follow up within hours instead of waiting for the next monthly report.
Step 5: Connect Your CRM Integration
Under “Integrations,” connect Qualaroo to your Salesforce or HubSpot account.
This routes every detractor response directly into a CRM workflow, so your CS team can close the loop without manual exports.
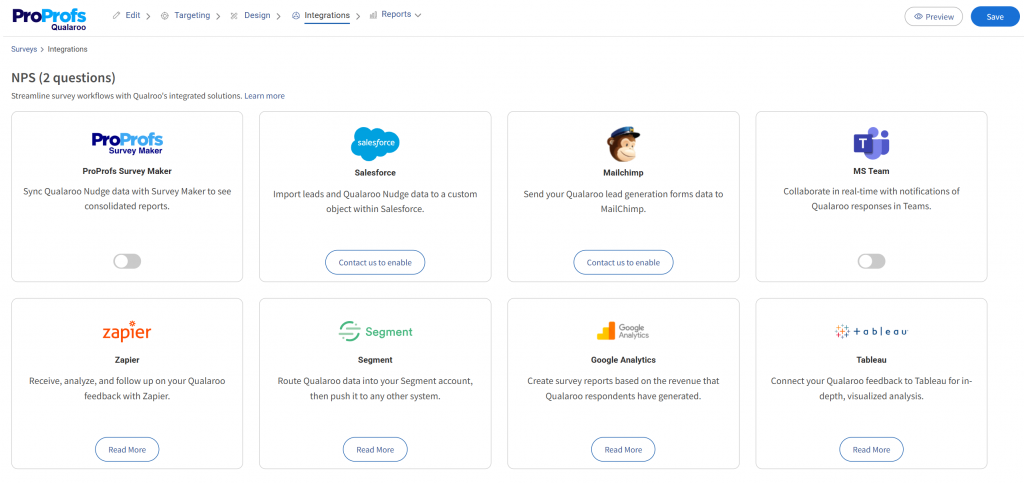
Step 6: Publish and Monitor
Publish the survey and watch the response rate from your Qualaroo dashboard in the first 48 hours.
If you’re seeing below 15%, check whether the trigger is firing at the right moment and whether your targeting window is too narrow.
Set an alert for any score of 0-6 so your team can follow up while the experience is still fresh.
Why Is Your NPS Survey Response Rate Low?
Once you have your baseline and have started improving, it helps to understand the structural reasons why response rates drop. Most low rates trace back to one of these four causes.
Survey Fatigue
The average consumer receives 3-5 feedback requests per week across subscriptions, apps, e-commerce, and support interactions.
Customers don’t consciously decide to stop responding. They develop an automatic dismissal reflex that applies broadly across all brands.
Research from User Intuition (2026) describes this as a conditioned response driven partly by perceived futility: customers who have completed surveys before but never seen any evidence that their feedback changed anything stop engaging.
Fred Reichheld, the creator of NPS, said at Medallia Experience 2025 that he no longer fills out surveys himself.
“They’ve been abused so horribly,” he told the audience.
When the inventor of your core loyalty metric has stopped participating in it, the fatigue problem is structural.
Channel Mismatch
Sending a linked email survey to someone who is actively inside your product is a lost opportunity. They would respond in-app.
Instead, they see an email hours later when the inbox is full, and the experience has faded.
Email NPS response rates have declined from 20-25% in 2019 to 10-15% in 2025, driven by inbox saturation and tabbed email filtering (User Intuition, 2026).
Poor Timing
Broad, relationship-style NPS surveys sent with no connection to a recent interaction yield the lowest response rates across all channels.
The customer sees no reason to engage right now. Contextual, post-interaction surveys consistently outperform.
Survey Design Problems
Long surveys, slider-format rating scales instead of tap-friendly buttons, and mandatory open-text fields all spike drop-off.
On mobile, where the majority of survey responses now originate, a single grid question or large text box can end a response in seconds.
A Low Response Rate Is a Signal Problem, Not a Survey Problem
Your NPS score is only as reliable as the data behind it.
An NPS survey response rate that’s too low doesn’t give you a small sample. It gives you a biased one, where your most at-risk customers are invisible, and your score looks better than it is.
The fix isn’t complicated. Move the survey closer to the moment. Trigger it when the experience is still live.
Link every response to a real user so your team can act on it, not just read it. Keep it to two questions. Follow up once.
Fix the channel. Fix the timing. Make responses attributable. Qualaroo’s Nudge™ moves the survey inside the product, to the right moment, for the right user.
The data gets better, the decisions get sharper, and your NPS becomes something you can trust.
Frequently Asked Questions
What is a good NPS survey response rate?
A good rate depends entirely on your channel. For email with embedded questions, 20 to 25% is solid. For in-app surveys, 27 to 36% is the benchmark. For SMS, anything below 40% underperforms. Always compare your rate against the specific channel you're using, never against a single universal number pulled from a different context.
What is the average response rate for NPS surveys sent by email?
B2B email NPS averages 12.4%, with a range from 4.5% to 39.3% depending on audience quality and survey design, according to Bain & Company benchmarks. B2B SaaS teams regularly reach 18 to 25% when they use product-led triggers and embedded survey formats instead of links to an external page.
What does a low NPS survey response rate mean for your data?
B2B SaaS email NPS averages 18 to 25% with product-led triggers, while in-app NPS reaches 20 to 36% for the same audience. Hitting 22% on email NPS already puts you ahead of roughly three-quarters of your B2B SaaS peers. The gap between channels is consistently one of the biggest levers available to improve response quality.
What is the NPS survey response rate benchmark for B2B SaaS?
B2B SaaS email NPS averages 18-25% with product-led triggers. In-app NPS achieves 20-36%. Hitting 22% on email NPS puts you ahead of roughly three-quarters of B2B SaaS peers, per Clootrack's 2025 research.
How does transactional NPS compare to relational NPS on response rates?
Transactional NPS, triggered after a specific interaction, achieves 25-40% response rates (CustomerGauge, 2026). Relational NPS, sent on a schedule, averages 15-25%. The gap exists because transactional surveys feel relevant to something that just happened. For transactional surveys, send within 0-10 days of the interaction, ideally within 2 hours. For relational surveys, a quarterly cadence for B2B is best practice.
How often should NPS surveys be sent to avoid survey fatigue?
For relational NPS, quarterly is the best practice for B2B. For transactional NPS, trigger immediately after the event, but suppress the same user from receiving any survey for at least 60 days after they respond. Coordinate across teams so the same contact isn't receiving NPS, onboarding check-ins, and CSAT surveys within the same 30-day window.
Is in-app NPS always better than email NPS?
In-app NPS yields higher response rates and more context-rich feedback from active users. Email NPS is still useful for users who aren't logging in regularly or for lapsed contacts as a fallback. The strongest programs use both: in-app for active sessions and email for users who haven't logged in recently.
How many NPS responses do you need for reliable data?
Bain & Company (creators of NPS) emphasize that response rates matter more for representativeness than raw numbers alone. They recommend aiming for high participation (e.g., 40%+ for B2C and ideally 60%+ for B2B contexts) to minimize bias and ensure the sample reflects your overall customer base. A constant flow of data (e.g., ongoing or weekly sampling) is preferred over one-off large surveys.
FREE. All Features. FOREVER!
Try our Forever FREE account with all premium features!

 We'd love your feedback!
What did you like & how can we make it even better?
 Thanks for your feedback!
 Ask Your Question
Have a question? Get expert help to make your decision easier.