In November, we released a set of new reporting functionality in Qualaroo’s reporting dashboard. Complete with improved NPS reporting, nudge performance statistics at a glance, and word clouds, we brought you new ways to get more out of your Qualaroo experience.
Now we’re introducing even more ways to help you better sort through your insights, understand the user journey, and more.
From a redesigned Sentiment Analysis with IBM Watson visualization, an intuitive new way to search, and increased filtering and favoriting functionality, we’re thrilled to see how these updates will improve and speed up your workflow! Keep reading for more information on how our brand new features can fit into your process and help you better organize your insights.
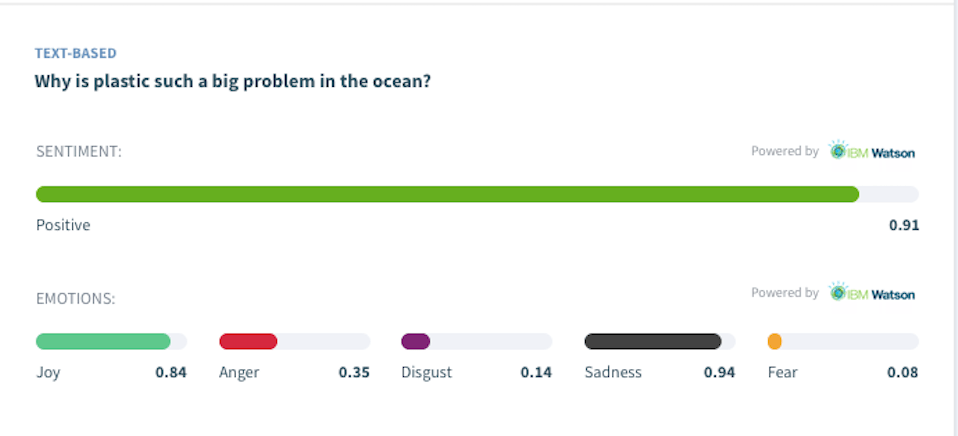
Sentiment Analysis with IBM Watson:
Why focus on the nitty-gritty of individual free-form responses when you can quickly gauge user emotions with IBM Watson? Watson breaks down and visually represents emotion in text-based responses by joy, anger, disgust, sadness, and fear, so you can take informed action, quickly.
Coupled with our new and improved reporting experience, Sentiment Analysis can help you transform your free-form responses into actionable insights. Not already using Sentiment Analysis with IBM Watson? Sign up for a demo today and we’ll help you get set up!
New ways to sort responses: favoriting and filtering by completion status
Users can now favorite any responses of their choosing for quick navigation. Easily revisit any type of response by favoriting it. You can also filter reporting based on ‘favorite’ status, to give you even deeper insight. Whether it’s revisiting responses that contain keywords or that are just particularly interesting, users don’t have to go through the hassle of sifting through all collected responses.

Similarly, you can also now filter nudge responses based on completion status. We love this feature because it can sometimes be misleading to include data from only partially filled-out nudges. On the other hand, you can use filtering by completion status to quickly identify users who you’d like to follow up with for more information.
More ways to filter means more ways to segment your data and get clearer insights.
Identities listed with responses
You’ll now see a snapshot of identity details associated with all responses. Quickly assess demographics of the respondent like the type of browser used, associated email, and more. We love this feature because it empowers users to reach out to respondents quickly.
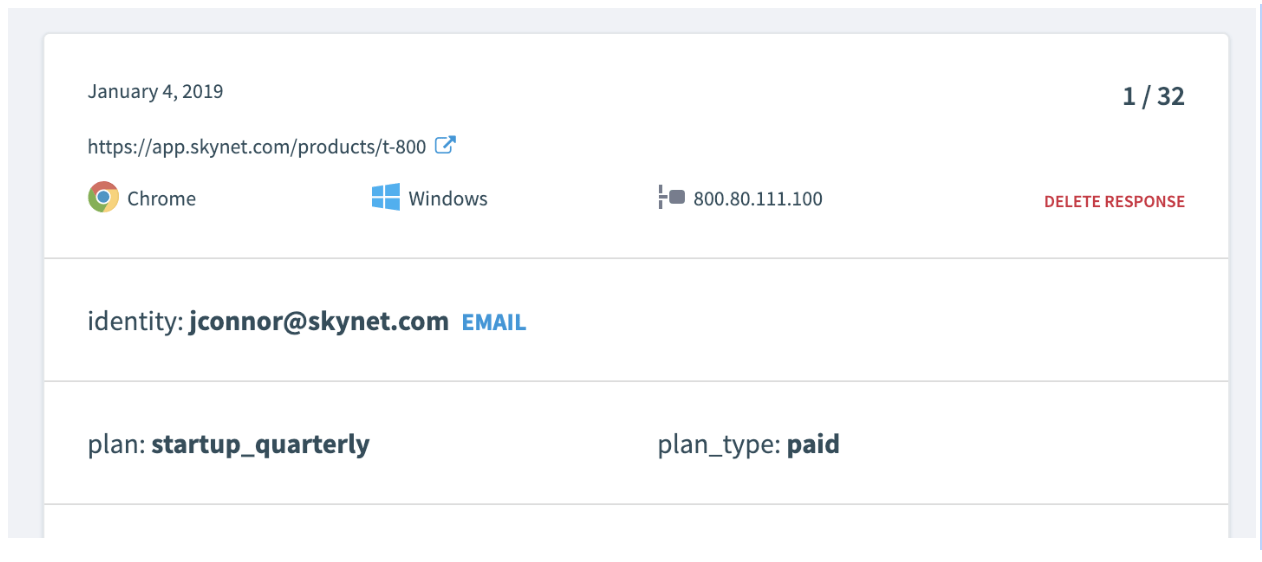
For example, if a response reveals something time-sensitive like a visitor having trouble purchasing, you can quickly send them an email. On the other hand, if a user reports a site-related issue, you can easily see pertinent information like what type of browser they are using in order to narrow down what might be causing their problem.
Here’s a video you can watch to learn how it works:
Better Together
The best part about our new features is that they are most powerful when used together. For example, you can use Sentiment Analysis to get a sense of how users feel about a particular feature, favorite responses mentioning that feature and filter reporting based on favorite status to get a sense of any trends or performance statistics. If you then decide you don’t actually have enough information, you can use filtering based on completion status to identify participants who didn’t finish the nudge questions to follow up for more information.
Used together, our new reporting features make finding the most relevant insights easier than ever before. Whatever your use case is, we look forward to seeing how our community is empowered to access and use their user insights much more easily and quickly than ever before.
Please note, the features mentioned above are only available in the beta version, meaning it will only work on reports with fewer than 10,000 responses. To activate the beta version, select the turn on beta reporting option at the top left of the dashboard. Please reach out to support@qualaroo.com if you have any questions.
FREE. All Features. FOREVER!
Try our Forever FREE account with all premium features!
 We'd love your feedback!
What did you like & how can we make it even better?
 Thanks for your feedback!
 Ask Your Question
Have a question? Get expert help to make your decision easier.