You have to know the lay of the land and do the groundwork first before testing the elements for improvement. Here are a few tips before commencing an A/B test.
1.) Decide on the Metrics to Measure the Test Results
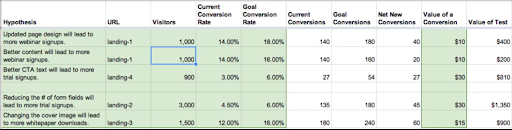
An effective way to prioritize the AB testing of elements is to align each element with the ROI. Then, find the element that would produce the maximum effect on your goals, say, conversion rate.
Here is a simple example of calculating the test value of each element by assigning conversion goals to them and comparing the results with the respective baseline values.
As you can see from the image, changing the fields on the CTA form will produce the highest conversion rate. This exercise will give you an idea of the A/B elements.
- To get the estimated goals for the elements, you can compare your target page with other better-performing pages with similar CTAs.
- Use the data from previous tests to assess the target goals for the current test.
- Use industry benchmarks to set a baseline goal to calculate the ROI.
2.) Test Only One Element at a Time
It is important to remember that if you are running an A/B test or Split test, you should test only one webpage element at a time. There are different reasons to support this:
- If you are testing multiple elements simultaneously, it makes it harder to determine each element’s role in producing the overall change in performance.
- It is also possible that only one element is causing the performance changes.Since multiple elements are altered in a single variation, you can’t keep track of each element separately, which may lead to inaccurate conclusions.
- If you want to understand the relationship between different altered elements, you may need to run multivariate tests, which require more resources and time.
Therefore, always test one variable at a time to produce reliable results in your A/B tests.
3.) Set the Statistical Significance
The statistical significance is a very crucial metric in A/B testing that helps to determine how reliable the test results are. For example, a confidence level of 95% means that there is a 1 out of 20 chance that the results are wrong. Similarly, 99% confidence level means 1 in 100 chances that the results are incorrect.
Most of the A/B testing tools today automatically show the statistical significance of the data. You can choose to set it to your desired value depending upon the scope of your test. Once the desired statistical significance is reached, you can end the A/B test or keep testing to increase the confidence level.
4.) Randomize and Split the Population Evenly Between All Variations
A good starting point to quickly collect the data in the A/B test is to randomly and equally split the visitors between the variations. For example, if you have two variations, set 50% of the visitors to see variation A and divert the other 50% to variation B.
Many A/B testing tools in the market, such as Optimizely, can automatically distribute the traffic depending on user behavior. It allows the test to quickly reach statistical significance and maximize the conversions even during the A/B test.
5.) Determine the Required Sample Size
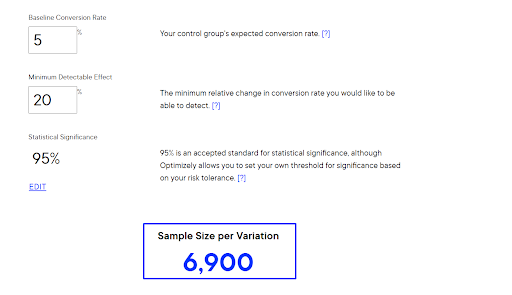
The sample size is the amount of traffic that you need on a variation to conclude the results are accurate and reliable. The higher the statistical significance and change in baseline conversion rate you are trying to achieve, the larger your sample size.
For example, using Optimizely’s sample size calculator, we can see, the sample size required to detect (+- 1)% change in baseline conversion rate at 95% statistical significance is 6900 per variation.
It also determines the amount of time you need to run the A/B test to achieve the required sample size and the desired confidence level.
A lot of A/B testing tools automatically determine the sample size required for a variation to achieve desired statistical significance.
6.) Estimate the Test Duration
Your test results are not only influenced by statistical significance but also test duration. Sometimes, the results might show a high confidence level early in the test, but the value may change with time.
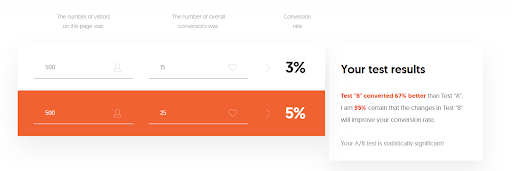
Let’s take an example. Suppose you run a test for a control page and its variation A. After two days, you see the results are shown in the image below:
As you can see, the results seem statistically significant.
Should you end the test?
No, because the sample size is still shallow. In this case, it is wise to wait for the sample to become more significant.
As mentioned in the previous point, the higher the sample size, the more reliable your test results.
That’s why you should calculate the required sample size first and then divide the website traffic according to the number of test variations to estimate the test duration.
Another way to estimate the length of your test is by observing the conversions. Peep Laja, a CRO expert, suggests achieving 300-400 conversions per variation before concluding the test.