Now that the A/B test results are in, it’s time to analyze them to find the winner. Different approaches to interpreting the A/B testing results can help you ensure that the data is reliable.
Let’s break it down into a step-by-step process to study the test results based on whether it was successful or not.
1. Analyzing a Successful A/B Test
a) Run Basic Analysis
Check the A/B test results to ensure that the test has reached its required confidence level and sample size. Let’s say that the statistics indicate variation (A) beats the Control (C) by producing more conversions or CTR.
Does it mean you can straight away implement the variation and remove the control design? No.
Dig deeper into the data by observing secondary metrics such as revenue, conversions, etc. It can help to spot false positives.
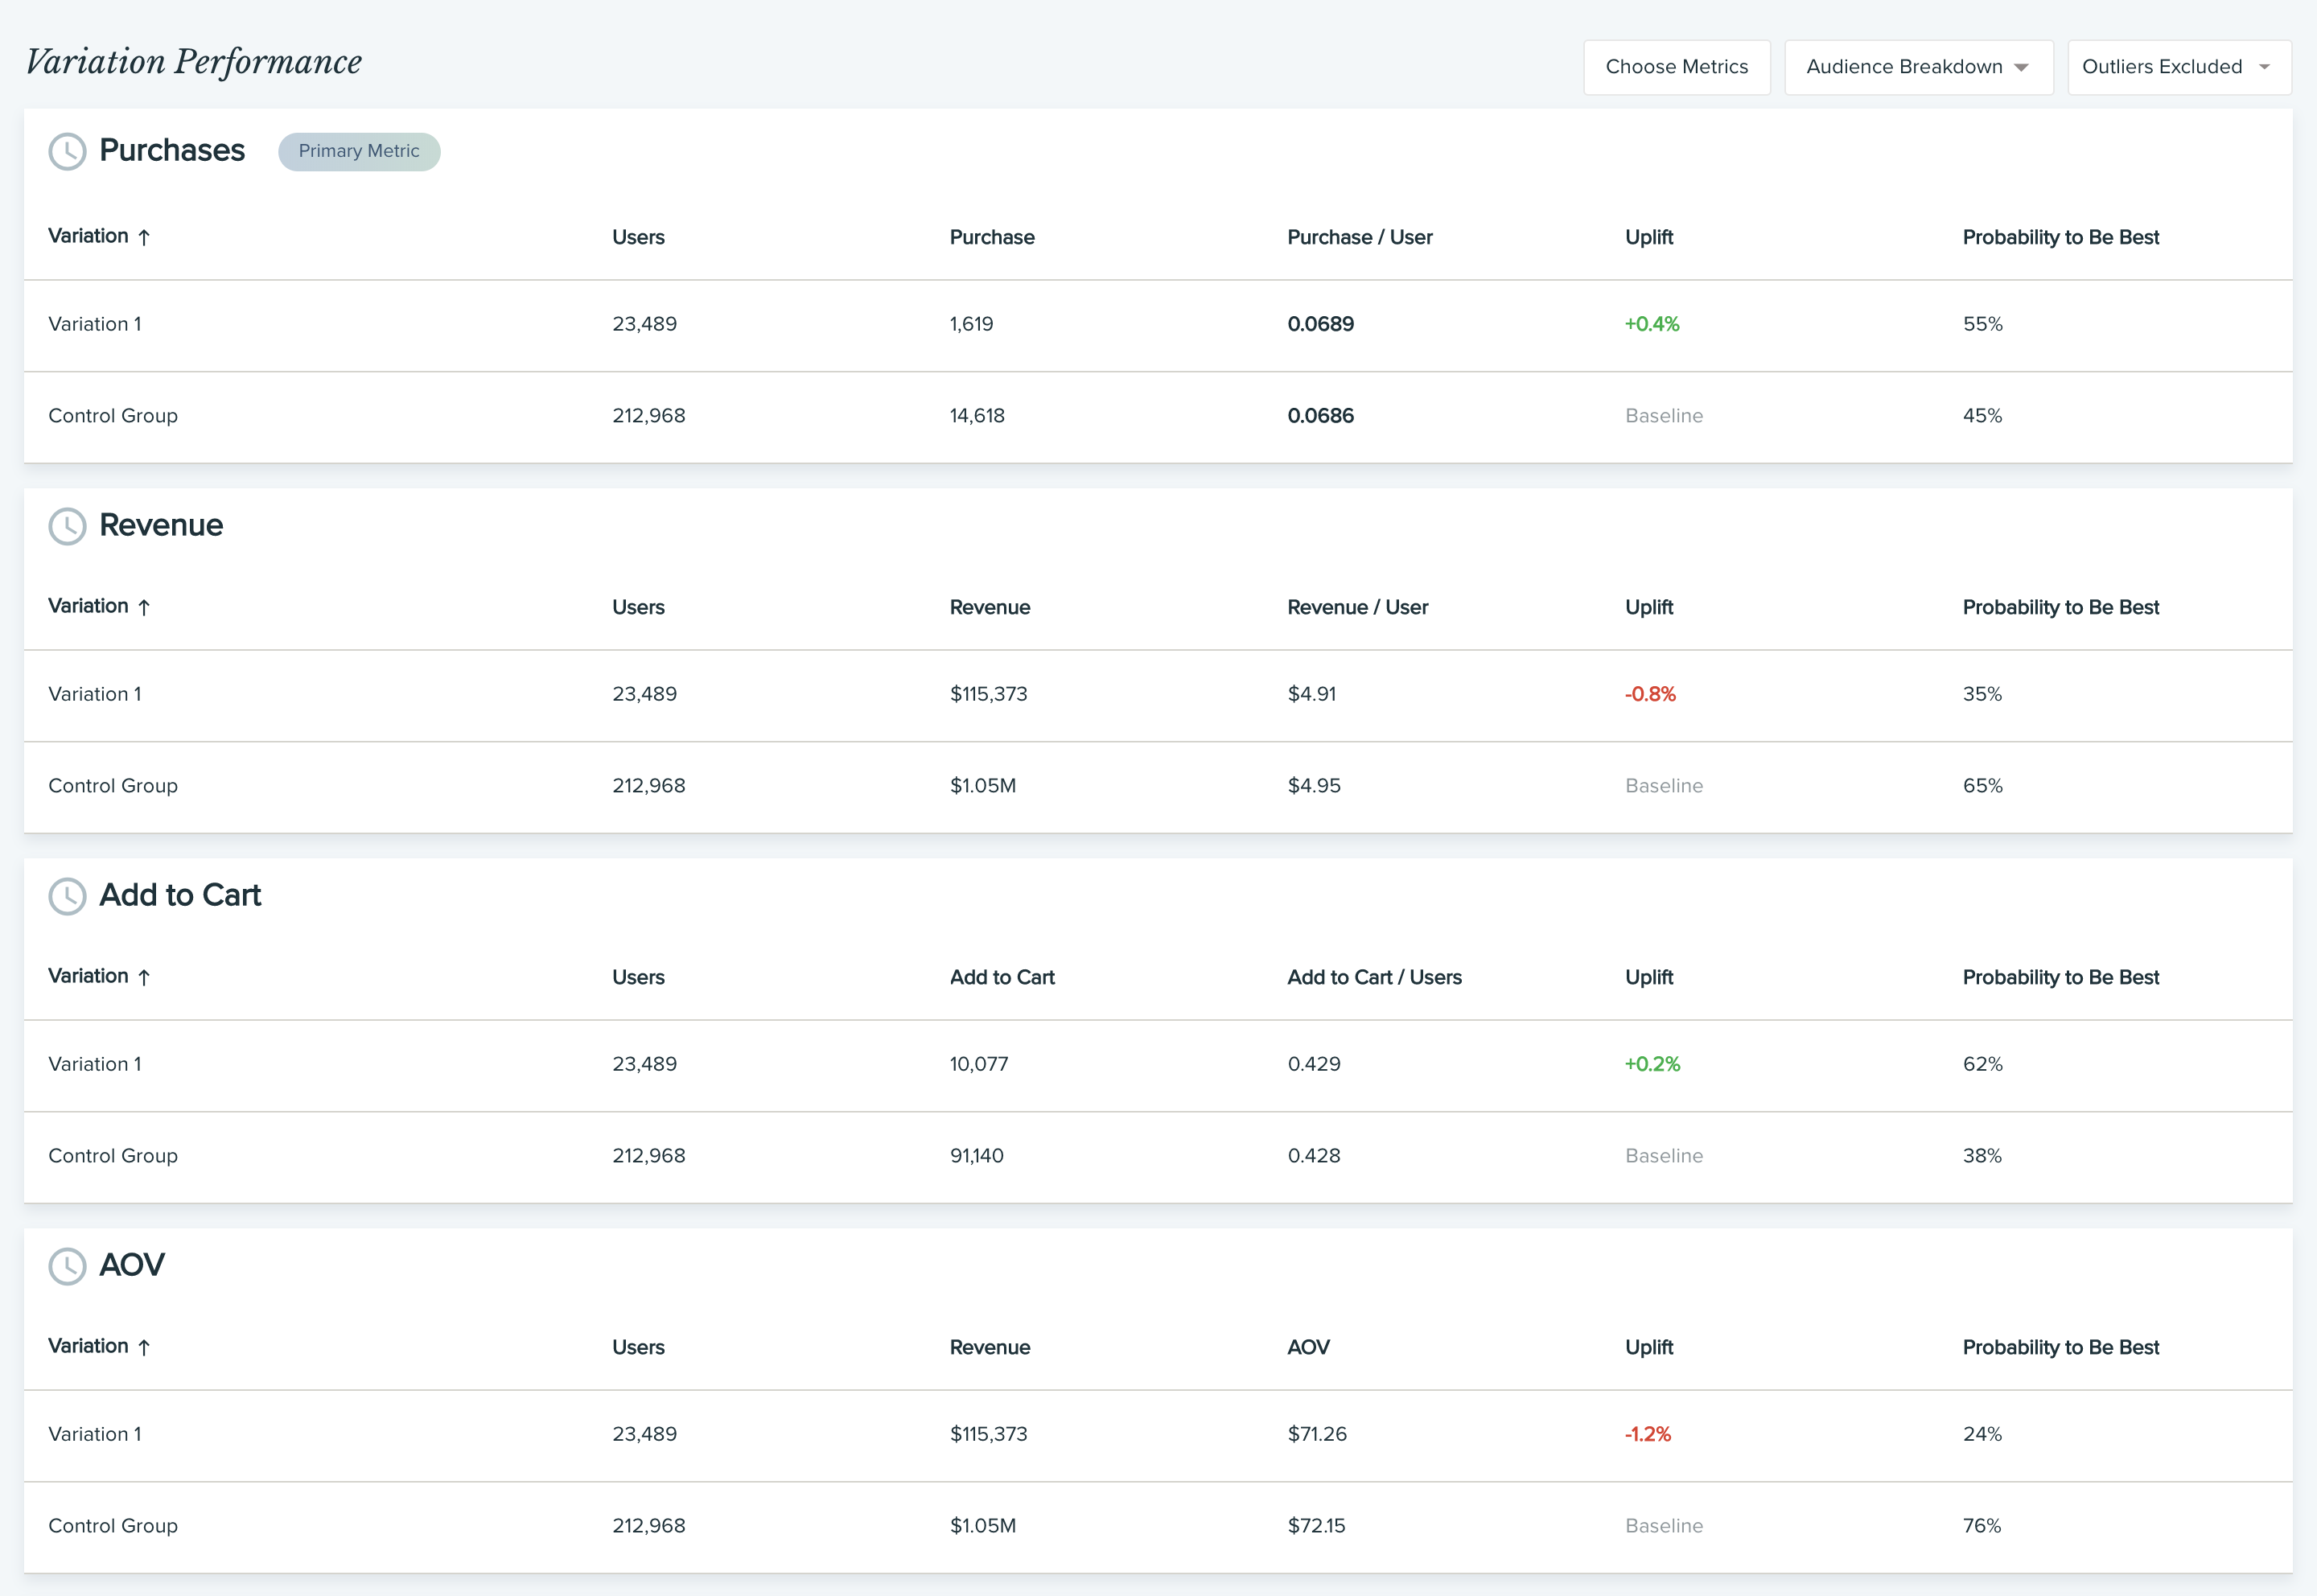
b) Look at Secondary Metrics
Suppose the variation manages to increase the click-through rate (CTR) on the page. But looking closely, you find that the revenue saw a drop producing an overall negative effect.
Once you have done the analysis, you can run a successive A/B test with desired variation and control C to see if it still comes out as a winner. It will establish the reliability of the test results.
A lot of A/B testing tools also keep track of these secondary metrics during the tests so you can compare them while analyzing the results.
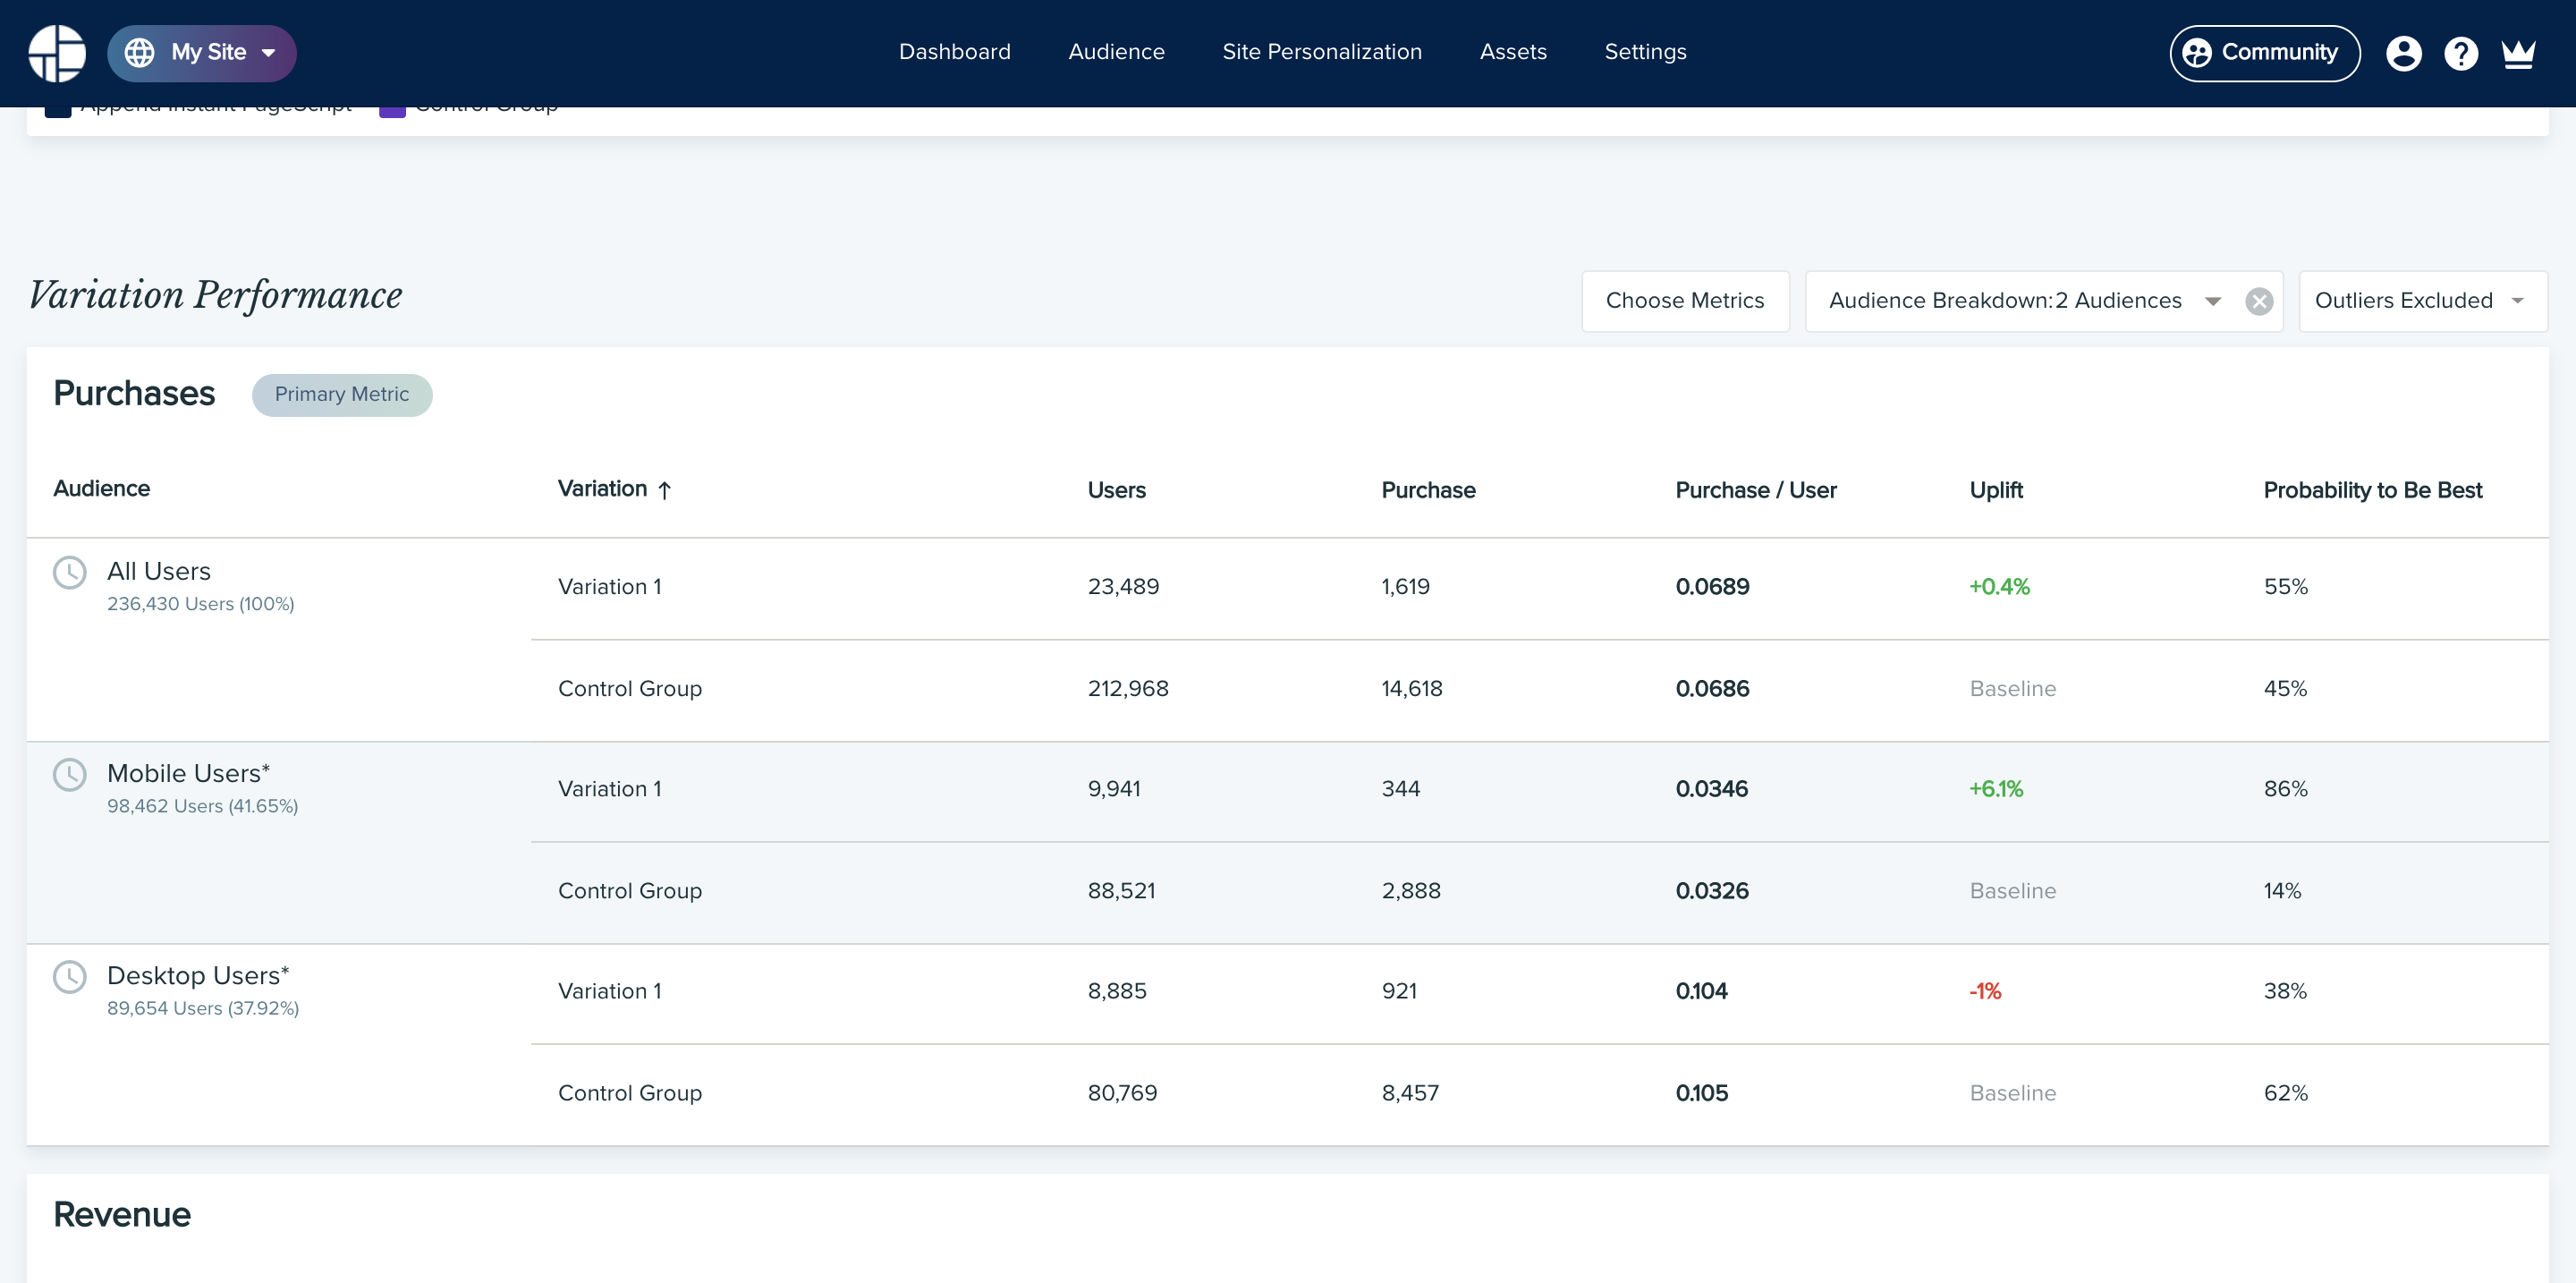
c) Do an Audience Segment Analysis
You can dive further into the data to see how each audience segment behaved towards the variation and control. It will let you compare which is the best variation for different users.
You can segment the data on different attributes, such as:
- Traffic source
- Visitor type
- Device type
Suppose you find that while variation A won the test for desktop users, variation B produced more conversions on mobile.
Using this information, you can run separate tests for mobile users and desktop users using the respective variations against control C to find whether the results are true or false.
2. Analyzing a Failed A/B Test
A failed A/B test is when the control outperforms the variations. Failed tests also offer valuable insights that can help you plan the next course of action.
Even in the case of a failed A/B testing, run a secondary analysis to see if the results are valid or not.
Suppose variation A produces lower conversions than control C. But you observe that it increased the average order values to the point that there is a net increase in the revenue even with a lower conversions rate. In this case, you can run the test for a longer duration to see if the conversions on variation A increases with time.
A failed A/B test can also help you refine your data for the next iteration.
Even if the variations show complete failure, you can reevaluate your research data, develop a new hypothesis and rerun the test.
For example, from the test results, you find that maybe variation should not have been about the color of the CTA but its placement on the page. Now that you have this insight, you can go to the drawing board, make the changes and test them.