

You have probably already run an employee satisfaction survey. You sent it, got a 3.6 average, shared a slide at an all-hands, and then moved on.
Six months later, the same problems are still there. Turnover ticks up. A few good people leave. Someone in a one-on-one finally says what the survey was trying to tell you all along.
The issue is not that you ran a survey. The issue is that the survey was never connected to a decision.
This guide is for teams that want to fix that. You will get:
- Exact questions to ask in an employee satisfaction survey
- Ready-to-copy templates for pulse and annual surveys
- A six-step framework to turn survey data into visible action
- Why employees do not give honest feedback
- How to design surveys that get truthful responses
Let’s begin!
Why Do Most Employee Satisfaction Surveys Fail to Change Anything?
An employee satisfaction survey is a structured questionnaire used by organizations to gauge how happy and engaged their workforce feels. It measures key factors like job satisfaction, work environment, leadership support, compensation, career growth, and work-life balance. The main goal is to identify improvement areas, boost morale, reduce turnover, and enhance productivity through anonymous employee feedback.
An employee satisfaction survey is a structured process for measuring how employees feel about their work, their manager, their team, and the direction of the organization.
When it works, it surfaces problems early, before they become a turnover issue. When it does not work, it produces polished averages that mask real friction and leave employees more cynical than before.
The gap between those two outcomes is almost never the question. It is what happens after.
Here is what HR and professional communities consistently surface about why surveys fail:
- The Black Hole Problem: Employees submit feedback and hear nothing back. No summary, no acknowledgment, no action plan. The next survey invitation lands in their inbox, and they ignore it, or fill it out with safe, mid-range scores designed not to cause trouble.
- The Anonymity Illusion: Surveys marketed as anonymous are often technically traceable via individualized links or referral IDs. Even without that, demographic combinations like role, tenure, department, and location can identify individual respondents in small teams. Employees under 20 know this.
- Performative Compliance: When employees do not trust the process, many default to scores of 3 out of 5 with neutral comments. Not negative enough to trigger attention. Not positive enough to seem dishonest. The result is data that looks clean and tells you almost nothing.
- The Retaliation Cycle: Negative scores can trigger defensive behavior from managers who feel their team’s results reflect on them personally. Employees who have seen that happen once stop giving honest answers permanently.
Understanding these failure modes is the first step to designing a staff satisfaction survey that actually works. Every section in this guide is built around fixing them.
How Do You Conduct an Employee Satisfaction Survey That Gets Honest Results?
Conducting an employee satisfaction survey that gets honest results means designing the process before, during, and after data collection, not just writing better questions.
The format, channel, timing, segmentation plan, and follow-through all shape what employees decide to share.
Most guides hand you a question list and call it done. That is the easy part. The real shift is this: you do not start from a blank document anymore.
Most teams default to long surveys sent over email. That is where the problem starts. You get delayed, filtered answers instead of real feedback.
The shift is this: capture feedback in the moment first, then layer structured surveys where needed.
Here is the full process.
1. Define the Decision This Survey Needs to Inform
Before you open any tool, be clear on what decision you are trying to make.
- Are you evaluating whether a new tool rollout is landing?
- Testing whether a recent reorg damaged trust?
For example: Employee feedback on recent restructuring, focus on communication clarity, manager support, and workload impact. The output reflects your intent, so you are not starting from disconnected questions.
2. Choose the Right Format and Channel for Your Team
- Decide survey type:
- Annual (15 to 25 questions) for strategy
- Pulse (3 to 7 questions) for specific events
- Use Qualaroo nudges for quick, contextual input
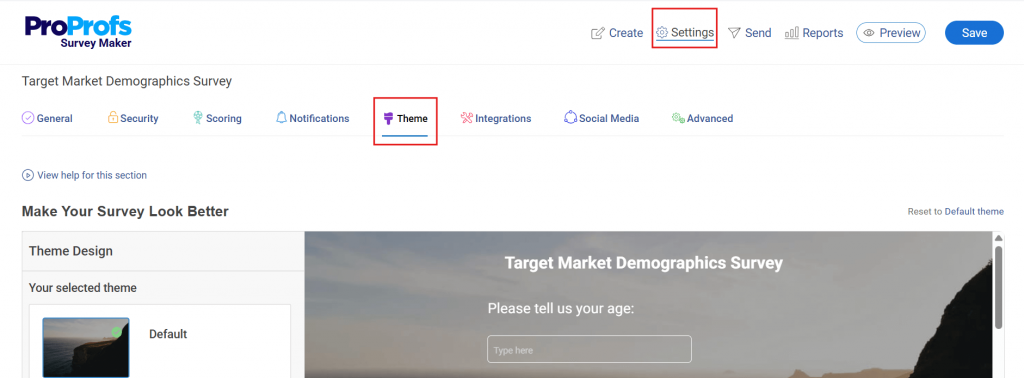
- Use ProProfs Survey Maker for deeper, structured feedback
- Map each survey to a moment (not a calendar date)
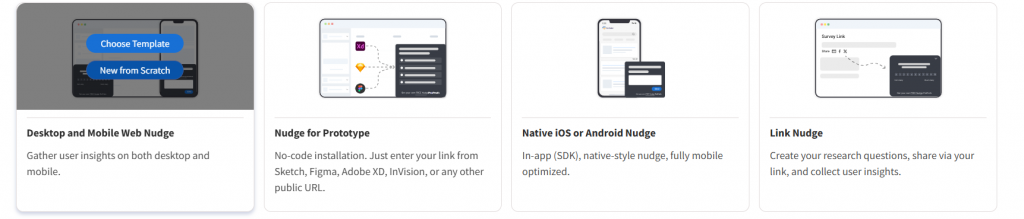
3. To Capture In-the-Moment Feedback Using In-App Microsurveys (Anonymous by Default):
- Open Qualaroo
- Click Create New Nudge

- Select Nudge Type (in this case, desktop and mobile web nudge)
- Add 1 to 2 questions:
- First: quick rating (for example: “How clear was this process?”)
- Second: open-text follow-up for low scores
- Use Branching Logic to send the right follow-ups
- Set targeting
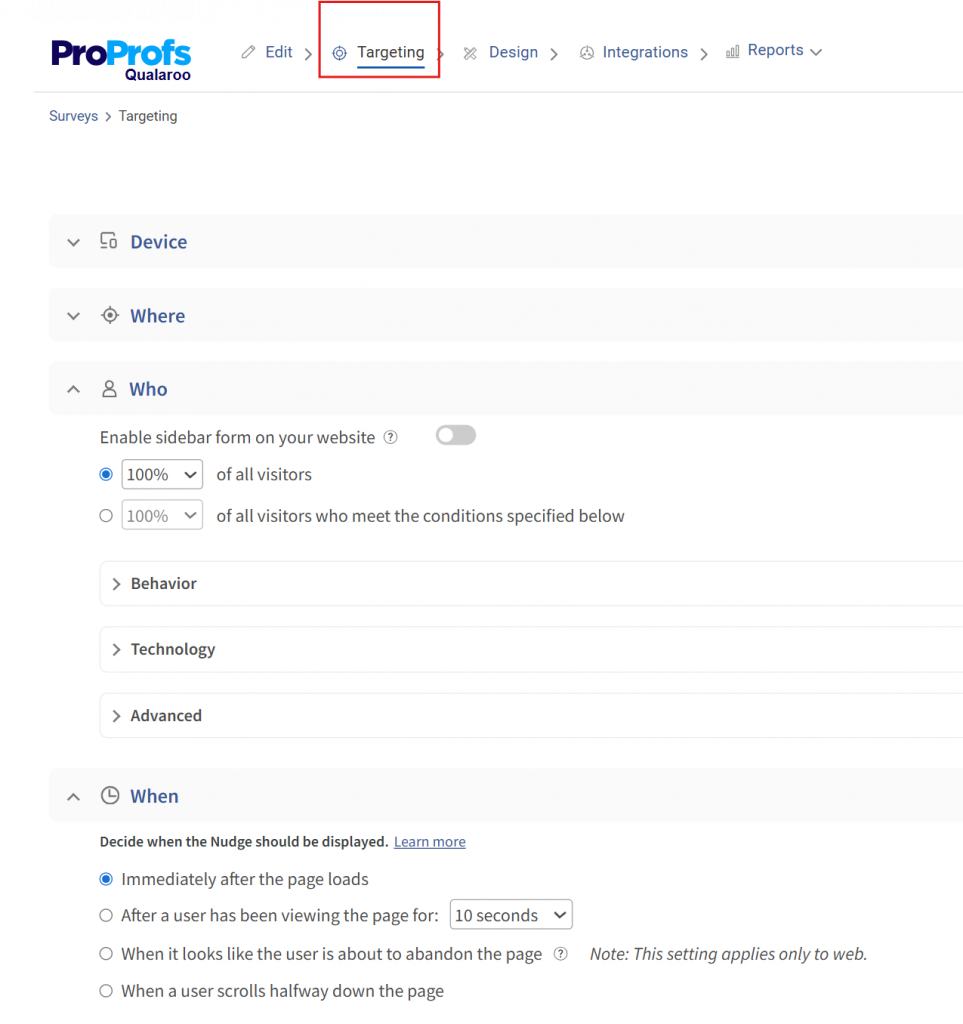
- Match nudge design to your internal tools
- Preview placement and timing
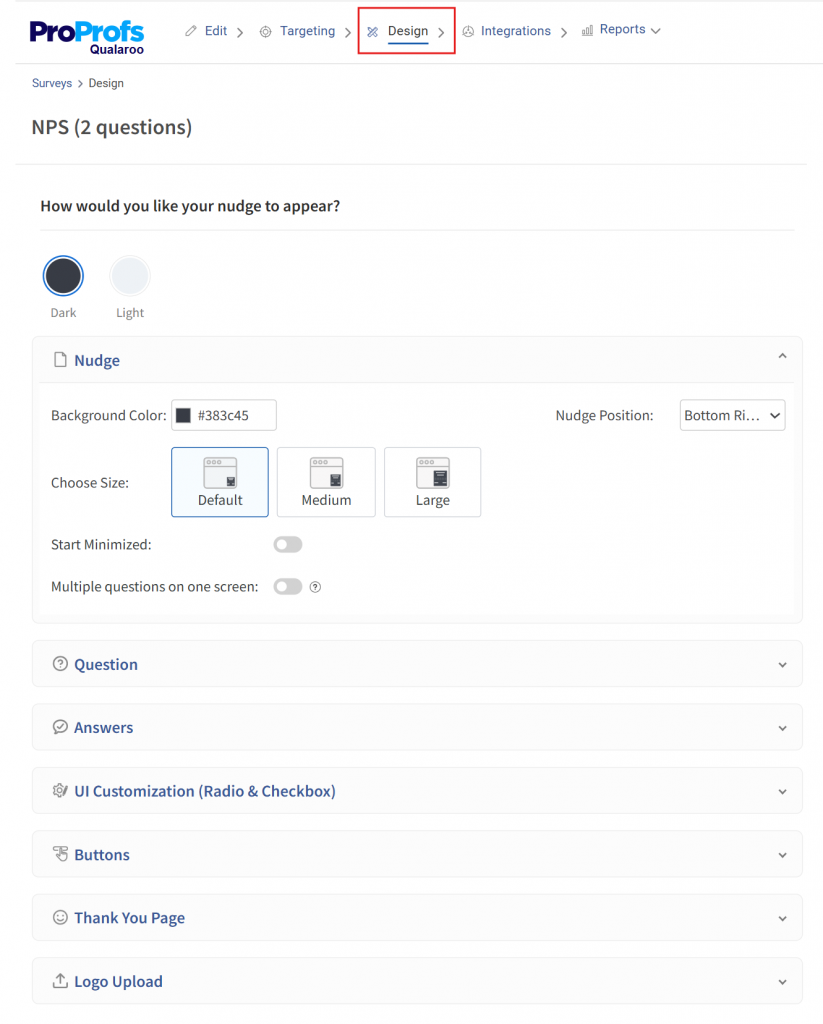
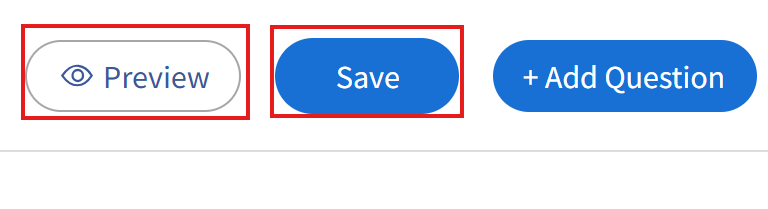
- Save and Preview your survey, and Activate it from your main dashboard
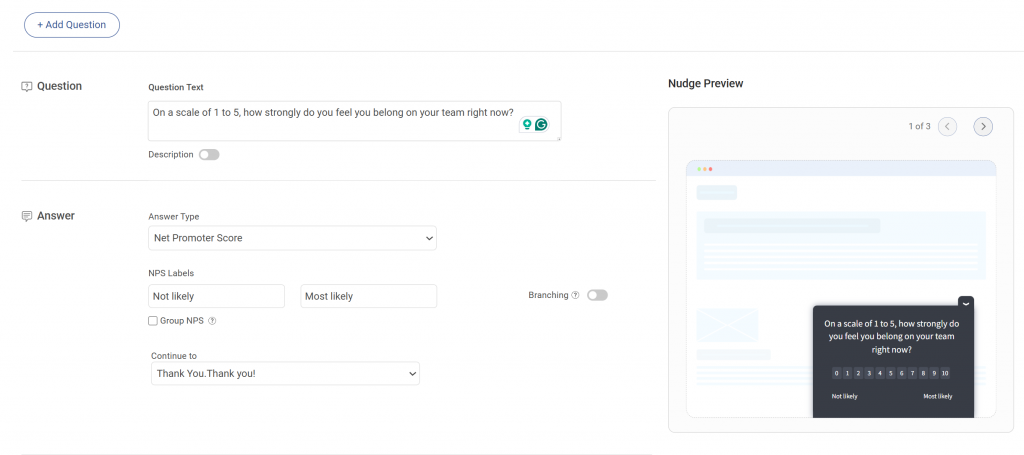
4. To Generate a Structured Survey Using AI:
- Open ProProfs Survey Maker and on the main AI Survey Maker widget, enter a prompt describing your goal (example: “Employee onboarding feedback, focus on clarity, friction, and manager support”)
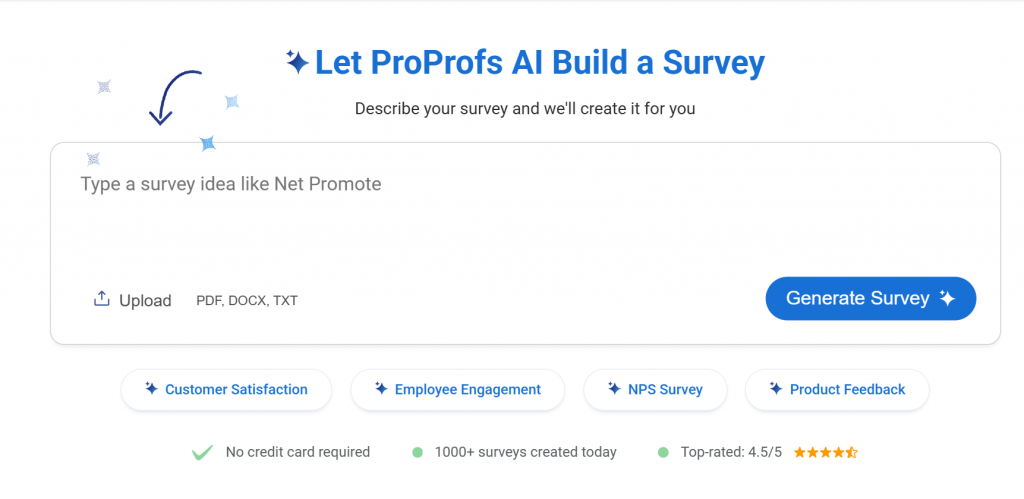
- Click Generate Survey
- Review the generated questions and flow. Edit your questions with AI to refine them
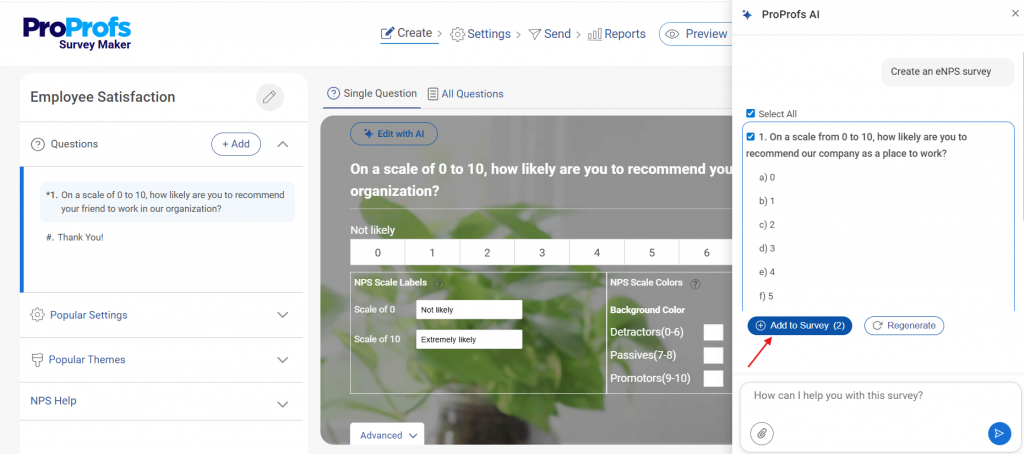
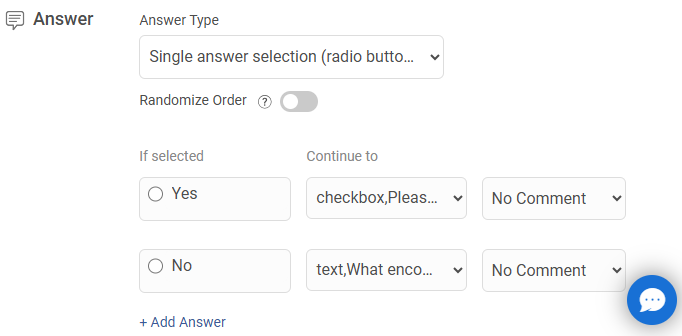
- Click Logic/Branching settings. Set conditions (example: if rating ≤ 3 → show follow-up question)
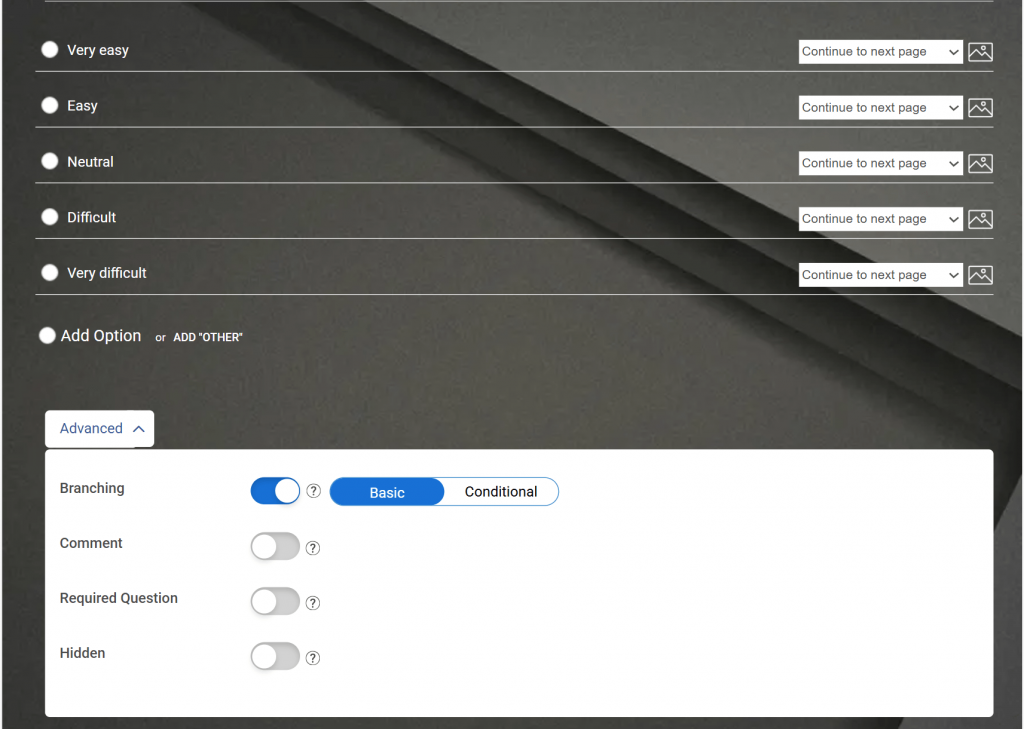
- Add logo and brand colors
- Click Preview and check the mobile experience
- Click Share → choose email or embed
- Launch via email or QR code.
- Set anonymity settings
Here’s a quick video for you to create your surveys with AI:
5. Close the Loop Within Two Weeks and Visibly
- Review results inside dashboards
- Identify the top 2 to 3 issues from ratings and comments
- Share what you heard with employees
- Assign owners to each issue
- Set a visible timeline for action
- Create a follow-up survey or nudge
- Schedule it for 60 to 90 days later
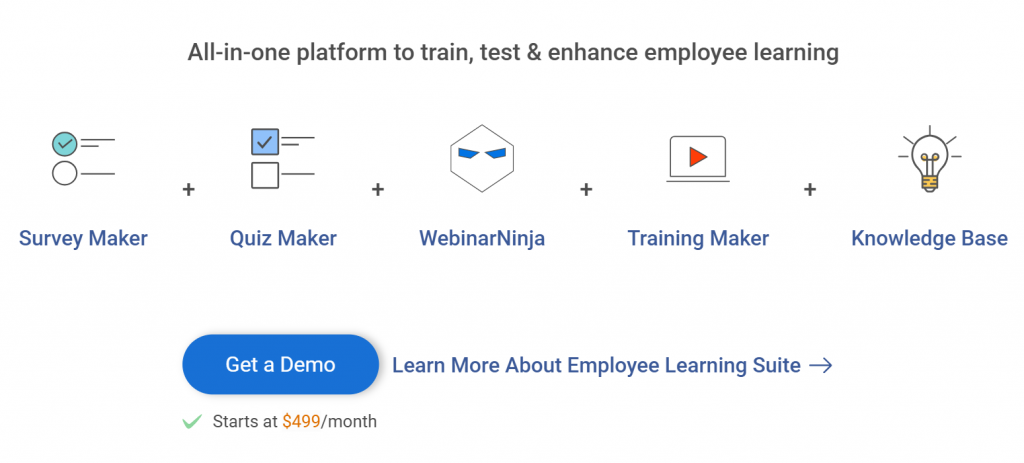
For comprehensive employee learning and engagement, you can go for the Smarter Employee Learning Suite:
What Questions Should You Include in an Employee Satisfaction Survey?
The best employee satisfaction survey questions measure specific, observable behaviors and day-to-day experiences rather than abstract feelings about the organization.
Questions that ask “How satisfied are you?” produce safe averages.
Questions that ask “Does your manager follow through on commitments” produce data you can act on.
Use the question bank below directly. Every question has a Likert scale version for tracking trends over time and an open-text version for depth when you need it.
Mix both formats within surveys, and rotate open-text questions across cycles so you never ask more than two or three at once.
Template 1: Pulse Survey (5 Questions, Under 4 Minutes)
Use after specific events: a reorg, a tool launch, a policy change, a leadership transition.
Introduction text: “This is a five-question check-in about your experience right now. Your responses are [anonymous/reviewed only by HR]. We will share a summary of what we hear within two weeks. It takes under four minutes.”
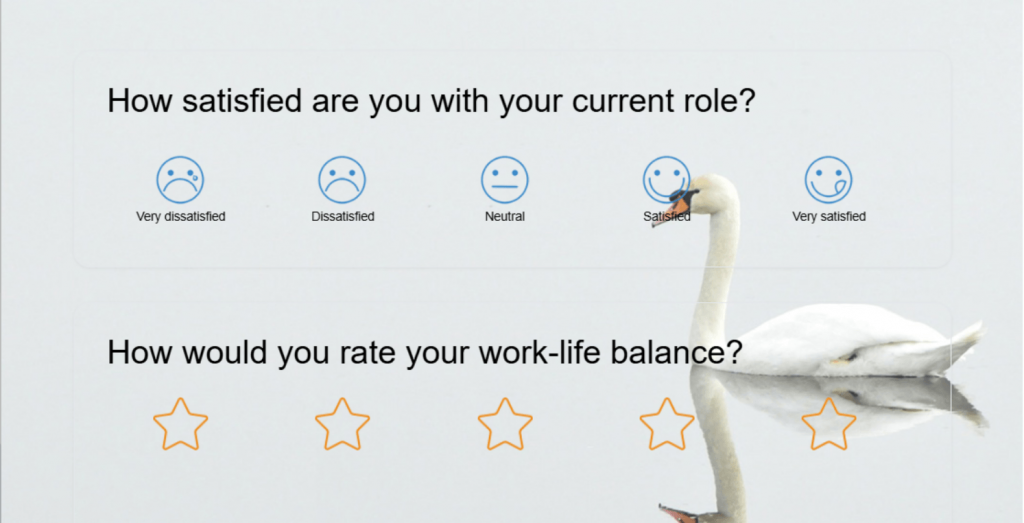
- How satisfied are you with your work this week? (1 to 5)
- Do you have what you need to do your job well right now? (Yes / Mostly / No)
- How clearly has your team been communicating recently? (1 to 5)
- How supported do you feel by your manager right now? (1 to 5)
- What is one thing we could do to make your work easier in the next 30 days? (open text)
Template 2: Annual Engagement Survey (20 Questions, 12 to 15 Minutes)
Use once per year for strategic planning and year-over-year benchmarking.
Introduction text: “This annual survey helps us understand what is working and what needs to change. It is [anonymous / reviewed only by HR]. We will share results with all employees within three weeks, along with the specific actions we plan to take. It takes about 12 minutes.”
Role and Clarity (1 to 5 scale)
- I have a clear understanding of my role and responsibilities.
- My workload is manageable on most days.
- I have the tools and resources I need to do my job effectively.
Here’s a role satisfaction template for your employees:
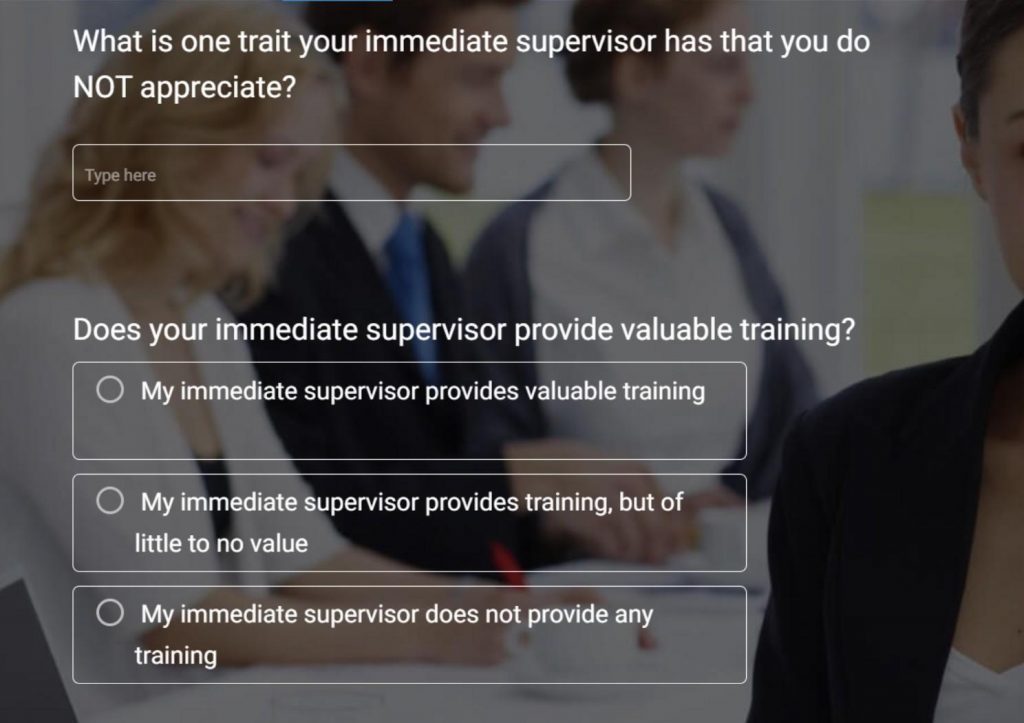
Manager and Leadership (1 to 5 scale)
- My manager gives me useful, timely feedback.
- My manager supports my professional development.
- Senior leadership communicates important decisions clearly.
- I feel comfortable raising concerns with my manager.
Here’s a template you can use for managerial feedback:
Team and Collaboration (1 to 5 scale)
- My team works well together.
- Communication across teams is effective.
Growth and Recognition (1 to 5 scale)
- I have real opportunities to grow in my role.
- My contributions are recognized.
- I can see a career path for myself at this organization.
Culture and Values (1 to 5 scale)
- I feel respected and valued at work.
- This organization acts in line with its stated values.
- I feel a sense of belonging on my team.
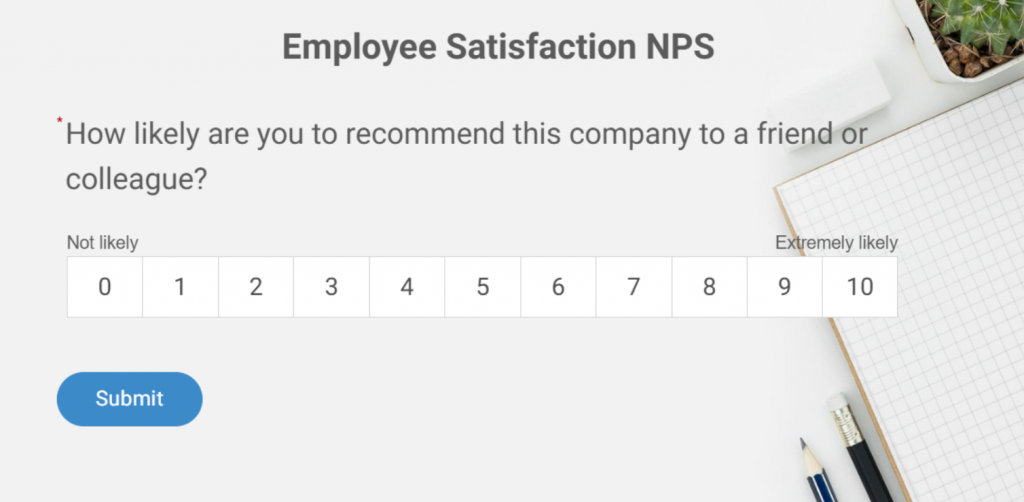
eNPS
- On a scale of 0 to 10, how likely are you to recommend this organization as a great place to work?
- What is the main reason for your score? (open text)
Here’s an eNPS template you can use:
Open Text
- What is the one thing that consistently gets in the way of your best work?
- What should we stop doing?
- What should we start doing?
Template 3: eNPS Nudge (3 Questions, Under 2 Minutes)
Use quarterly as a lightweight benchmark. Best deployed as an in-app nudge triggered automatically after a key employee action or milestone. An in-context survey surfaces inside the tool the employee just used, not in a separate email that they may not open for two days.
Introduction Text: “Three quick questions. Takes under two minutes. We read every response.”
- On a scale of 0 to 10, how likely are you to recommend this company as a great place to work?
- What is the biggest reason for your score? (open text)
- What would most improve your experience here in the next 90 days? (open text)
| Category | Score Range | Description |
| Promoters | 9 to 10 | Highly satisfied and loyal employees |
| Passives | 7 to 8 | Neutral, not actively engaged |
| Detractors | 0 to 6 | Unhappy and at risk of leaving |
Here’s an NPS survey template you can tweak and use:

Here’s a resourceful employee satisfaction survey kit to help you with employee satisfaction:
What Metrics Actually Evaluate Job Satisfaction?
Job satisfaction metrics are quantifiable indicators that measure how employees feel about their work conditions, relationships, growth opportunities, and organizational direction. The most useful metrics track both sentiment scores and the reliability of your data collection process over time.
Scores are only useful if you know what they are telling you. Here are the six metrics worth tracking, what each measures, and what a healthy benchmark looks like.
| Metric | What It Measures | How to Calculate | Benchmark | Best Used For |
|---|---|---|---|---|
| eNPS | Likelihood to recommend as an employer | % Promoters minus % Detractors | +10 to +30 healthy, +50 exceptional | Quarterly sentiment trend |
| Internal SAT | Satisfaction with a specific process or tool | Average score on a 1 to 5 scale | Above 4.0 is strong | Post-event, tool rollouts, and onboarding |
| Engagement index | Motivation, commitment, connection | Composite of 5 to 12 survey items | 31% engaged in the U.S. | Annual strategic review |
| Manager effectiveness score | How employees rate their direct manager | Average of behavior-specific questions | Use internal trending, not industry benchmarks | Manager development, HR interventions |
| Voluntary turnover rate | Employees who chose to leave | (Voluntary departures / avg headcount) x 100 | Under 10% annually is strong for most industries | Lagging confirmation of what surveys signal early |
| Survey response rate | Trust in the feedback process | (Responses/invites sent) x 100 | 70% or above is healthy | Leading indicator of process trust |
A low eNPS with a 75% response rate and detailed open-text responses is worth more than a high eNPS with 30% participation and no comments. Optimize for honesty, not score optics.
FREE. All Features. FOREVER!
Try our Forever FREE account with all premium features!
Why Do Employees Not Give Honest Answers, and How Do You Fix That?
Employees self-censor on satisfaction surveys, even anonymous ones, because the perceived risk of honest answers is higher than the perceived reward of giving them. The patterns behind this behavior are consistent and well-documented across HR and professional communities.
This is the section most guides skip entirely. It is also the most important one if you want data you can actually trust.
Identification by Deduction: In teams under 20 people, demographic metadata like role, department, tenure, and location can make individual respondents identifiable without any technical tracing. Employees who understand this give deliberately vague answers or skip open-text fields entirely.
Stylometry: Managers familiar with their team often recognize individual employees by writing patterns, specific phrases, or grievances raised privately before. Employees who know this either avoid open-text questions entirely or write in deliberately generic language. Some now use AI tools to rewrite their feedback and strip identifying patterns before submitting.
Performative Compliance: When employees do not trust the outcome, they give 3-out-of-5 scores with neutral comments. The survey looks fine. Turnover arrives as a surprise.
The Comfort Rule: A common principle widely shared in HR communities: never write in a survey anything you would not be comfortable saying directly to your manager’s face. The fact that this advice is widely repeated tells you exactly how employees actually experience “anonymous” surveys.
Jeanne Meister, founding partner of Future Workplace and a recognized voice in SHRM-covered HR research, emphasizes the value of demographic questions in surveys for uncovering deeper trends:

“The purpose of asking demographic questions is to uncover trends among various segments of employees and proactively address these trends before they become an issue. This is a key way to measure employee sentiment and develop a course of action to avert issues before they become major problems.”
— Jeanne Meister, Founding Partner, Future Workplace
This ties directly into anonymity and honesty: demographic data (when handled with care) allows organizations to spot patterns across groups without compromising individual confidentiality.
However, the entire process hinges on trust; if employees doubt that their responses (anonymous or not) are truly protected, they may answer dishonestly, such as by falsifying basic details like tenure or role.
Meister’s perspective highlights how thoughtful survey design, paired with genuine commitment to acting on insights, builds the credibility needed for candid feedback.
Here is what actually shifts this dynamic:
- State explicitly what is and is not traceable. If a third-party tool processes responses without individual identifiers, name it and explain it in one sentence.
- Limit demographic questions to what analysis genuinely requires. Collecting data that makes small-group respondents identifiable costs you honest answers.
- Frame the survey as a problem-finding tool, not a satisfaction check. “We are looking for what is not working” invites more candid responses than “Tell us how you feel.”
- Show what changed after the last survey before launching the next one. This is the single most powerful trust-building action available to you. Most organizations skip it entirely.
What Open-Ended Questions Actually Reveal True Employee Sentiment?
Open-ended employee survey questions are free-text prompts that invite employees to describe their experience in their own words, rather than selecting a score on a scale.
They surface the specific context, examples, and frustrations that Likert scale questions cannot capture on their own.
The framing of the question determines what you get back. “What do you enjoy about working here?” produces highlights.
“What is one thing that, if changed, would make your work significantly better?” produces action items.
Use these eight questions selectively, two or three per survey, rotated across cycles:
- What is the one thing that consistently gets in the way of you doing your best work?
- If you could change one thing about how this team operates, what would it be?
- Is there anything you have wanted to raise with your manager but have not felt comfortable doing? If yes, what made it feel difficult?
- What would need to be true for you to still be here in two years?
- Describe a recent moment at work where you felt most energized or proud of what you accomplished.
- What do you think leadership does not fully understand about the day-to-day experience of your role?
- What is one thing this organization does well that you hope never changes?
- If a friend asked you what it is really like to work here, what would you tell them?
Design Rule: Never include more than three open-text questions in a single survey. Response quality drops sharply after the third one. Use them in rotation across survey cycles, not all at once.
Here’s how you can analyze sentiments through open text:
How Does Satisfaction Differ Across Roles, and Why Does That Change Everything?
Role-based satisfaction analysis is the practice of segmenting employee survey results by job type, seniority, location, or work arrangement to identify which groups have distinct satisfaction drivers, rather than applying company-wide averages to everyone.
Running a company-wide survey and reading the overall average is the most common way to miss what is actually happening inside your organization.
Frontline employees, remote workers, managers, and new hires have fundamentally different satisfaction drivers. Treating them the same in your analysis is how problems stay invisible until they become turnover.
| Role Type | Top Satisfaction Drivers | Common Pain Points | Best Survey Format |
|---|---|---|---|
| Frontline/ Operational Staff | Schedule predictability, manager fairness, and recognition | Feeling unheard, unclear expectations, inadequate tools | Short post-shift pulse (2 to 4 questions) |
| Remote Employees | Flexibility, async communication quality, and inclusion | Isolation, unclear priorities, and career visibility | Bi-weekly 5-question pulse, monthly open text |
| Hybrid Workers | Policy fairness, balance of in-office and remote expectations | Inconsistent policy, unequal manager access, and meeting overload | Event-triggered nudges at key decision points |
| Managers | Strategic clarity, senior leadership support, and team health | Accountable for scores without authority to change conditions | Separate manager-specific annual survey |
| Tenured Employees (5+ Years) | Autonomy, purpose, organizational direction | Being passed over for growth, feeling stagnant | Annual deep-dive with career trajectory questions |
| New Hires (Under 1 Year) | Onboarding quality, role clarity, and manager relationship | Unclear expectations, insufficient training, and cultural fit uncertainty | 30/60/90-day check-ins |
Before drawing any conclusion from survey results, segment by role type and tenure. A company-wide score that looks healthy can conceal a frontline team burning out quietly or a group of five-year employees who have mentally checked out but have not left yet.
How Do You Turn Satisfaction Survey Data Into Action Leadership Can Stand Behind?
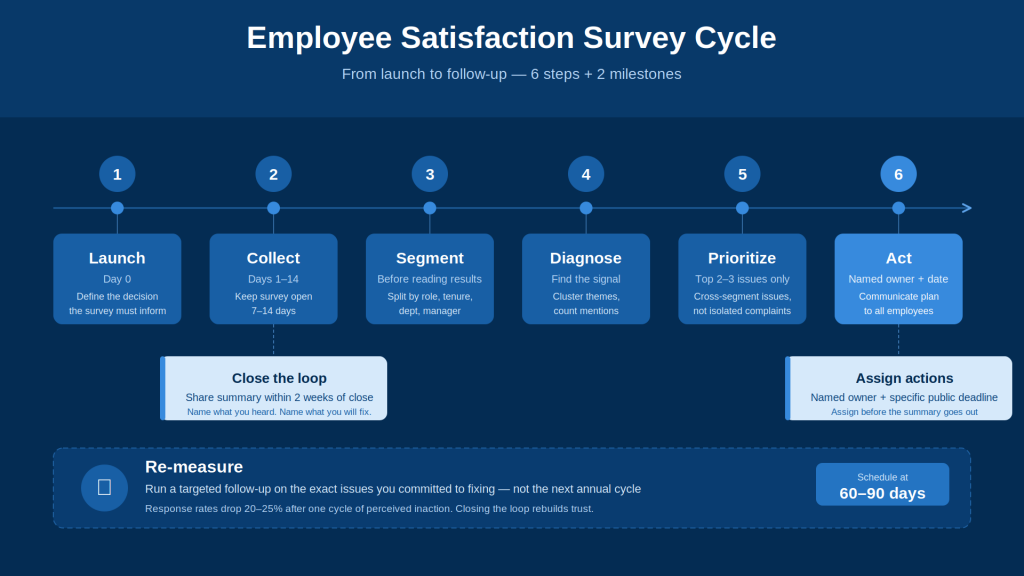
The satisfaction measurement framework is a six-step process that connects raw survey data to visible organizational action: collect, segment, diagnose, prioritize, act, and re-measure. Each step builds on the previous one, and skipping any step breaks the chain between employee feedback and leadership credibility.
Collecting data is the part that most organizations do reasonably well. Converting it into visible action is where almost everyone stops short. Here is the end-to-end process.
- Collect. Match the format and channel of the employee satisfaction survey to where employees actually work and what decision you are informing. Do not default to email links because they are easy to send.
- Segment. Before opening the results, divide them by role type, department, tenure, and manager. Company-wide averages are a starting point, not a conclusion.
- Diagnose. Identify scores that are outliers relative to other segments and to previous cycles. Cluster open-text responses by theme and count mentions. One intense comment is a signal. Ten employees mentioning the same theme briefly is a fire.
- Prioritize. Choose the two or three issues that appear across multiple segments, not isolated complaints. These are the ones you can own publicly and make visible progress on within 60 days.
- Act. Assign a named owner to each priority. Set a specific target date, not a vague commitment. Communicate the action plan to employees with both the owner’s name and the timeline.
- Re-measure. Run a targeted follow-up specifically on the issues you said you would address. Do this in 60 to 90 days, not at the next annual cycle. This is the step that rebuilds trust in the process and improves data quality in every survey you run after it.
Where most organizations break down: action plans get created in a post-survey meeting and then quietly deprioritized.
Employees check for changes, see none, and give you 3-out-of-5 scores with empty open-text fields at the next survey.
Research from HR communities indicates response rates drop 20% to 25% after one cycle of perceived inaction. Closing the loop is not optional. It is the mechanism that makes the entire process work.
FREE. All Features. FOREVER!
Try our Forever FREE account with all premium features!
Ready to Run a Survey Your Employees Will Actually Answer?
If your current process is an annual employee satisfaction survey email with a 40% response rate and no visible follow-up, the problem is not the questions. It is the tool and the process behind it.
Qualaroo lets you trigger short, targeted surveys inside the tools your employees already use, right at the moment of experience. It offers a forever-free plan (50 responses, 500 email sends, 10k pageviews). Paid plans start from $19.99/month.
A three-question nudge after a process closes. An eNPS check-in embedded in your internal Salesforce dashboard.
A 30-day onboarding pulse is sent automatically. You stop chasing people via email and stop waiting until year-end to find out something broke six months ago.
Frequently Asked Questions
How often should you run an employee satisfaction survey?
Annual surveys work for strategic decisions: compensation, org design, long-term culture initiatives. They give you 12 months to act and show progress before asking again. Pulse surveys with three to five questions work best when tied to specific events. Post-action nudges work for digital-first teams, triggered automatically after a key employee milestone. Match cadence to purpose, not calendar.
How does leadership impact employee satisfaction?
Manager quality is the single strongest predictor of team-level satisfaction. Direct manager behavior accounts for a larger share of satisfaction variance than compensation, benefits, or stated company values. The behaviors that move scores the most are clear feedback, following through on commitments, consistent fairness, and visible advocacy for team members' growth. Ask about specific behaviors, not overall ratings, to get data you can act on.
What is a good score on a workplace satisfaction survey?
An eNPS between +10 and +30 is considered healthy for most organizations. Internal CSAT above 4.0 on a five-point scale is generally strong. What matters more than the absolute number is whether scores improve over time and whether your response rate is high enough to make the data meaningful for your team size.
How many questions should an employee satisfaction survey have?
For an annual survey, 20 to 25 questions is the practical ceiling before completion rates drop. For a pulse survey, keep it to five to eight questions. For a post-action in-app nudge, two to four is ideal. Match length to context and purpose, not to how many things leadership wants to know.
How do you increase response rates on an internal survey?
Show employees what has changed after the previous survey. More than reminder emails, incentives, or anonymity guarantees, a visible "here is what we heard and here is what we did" drives participation in the next cycle. Short surveys with a clearly stated purpose also consistently outperform long omnibus forms.
What is the difference between employee satisfaction and employee engagement?
Satisfaction measures how an employee feels about current conditions: pay, environment, manager, and workload. Engagement measures how motivated and committed they are to contribute. You can have satisfied employees who are not particularly engaged, and engaged employees who have real complaints. Both require different survey questions and different interventions.
What should you do in the two weeks after running an employee satisfaction survey?
Share a summary with employees within two weeks of closing the survey. Name what you heard. Identify the two or three priorities you will address and assign named owners with specific timelines. Schedule a follow-up check-in on those specific issues within 60 to 90 days. Speed and specificity here determine whether anyone responds honestly to your next survey.
How do you handle low satisfaction scores from a specific manager or team?
Low scores from a specific manager require a direct, behavior-specific conversation framed around what the data shows, not a global evaluation. Give managers access to their own team's results and help them build a response plan. Transparency without a support structure creates defensiveness, not improvement.
What is the most common reason employee satisfaction surveys produce useless data?
The first is leadership running surveys without acting on them. A close second is collecting company-wide data without segmenting by role, tenure, or department, then drawing conclusions too blunt to act on. Both share the same root: treating the survey as the end of the process rather than the beginning of it.
FREE. All Features. FOREVER!
Try our Forever FREE account with all premium features!
 We'd love your feedback!
What did you like & how can we make it even better?
 Thanks for your feedback!
 Ask Your Question
Have a question? Get expert help to make your decision easier.