If you’ve worked in customer experience for more than five minutes, you already know that everyone has an opinion about NPS. Some people swear by it, some people swear at it, and most of us sit somewhere in the middle, trying to make sense of the score while juggling everything else on our plates.
But here’s the real story. Customer expectations are speeding ahead, companies are scrambling to keep up, and the gap between what leaders think is happening and what customers actually feel has never been wider.
At the same time, the brands that take feedback seriously are quietly pulling away from everyone else. They grow faster, they earn more referrals, and their customers stick around without needing a thousand retention tricks.
That’s why my team and I have pulled together the most important NPS statistics from the past few years. Not the fluffy ones, but the numbers that actually tell you what’s shifting and where the opportunities are. These NPS stats will give you a clear, grounded view of what’s working and what’s not.
Let’s not waste any more time! Before we begin, here’s a quick introduction to NPS:
Overall NPS System Effectiveness & Business Outcomes
Before we get into the numbers, here’s the big picture. NPS isn’t popular just because it’s simple. It’s popular because the companies that treat it as a serious operating system tend to grow faster, keep customers longer, and generate the kind of referral flywheel money can’t buy.
A few patterns show up again and again: teams align better, loyalty compounds into real revenue, and customer-led growth becomes way more predictable. When you look at the data, it’s hard to miss.
Here are the NPS statistics that show why NPS has such a strong grip on the business world:
- The Net Promoter System is now the most widely used customer success framework, adopted by two-thirds of the Fortune 1000 (HBR).
- Companies that lead in customer loyalty grow at twice the rate of their industry peers (Bain & Company).
- Public companies recognized as NPS leaders delivered five times the median total shareholder return over the past decade (HBR).
- Organizations implementing a full Net Promoter System typically see 10+ point NPS gains within the first year (Bain & Company).
- Companies with net revenue retention above 130% are valued more than 2.5 times higher than those below 110 percent (HBR).
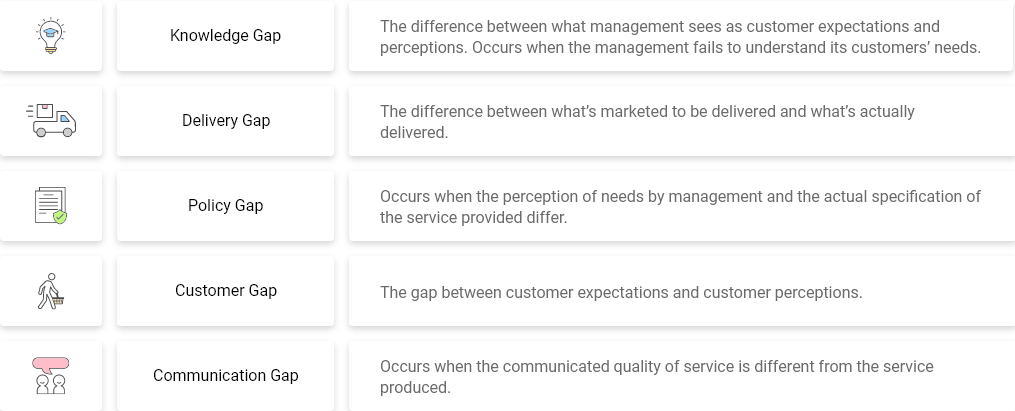
Executive Perception, Customer Sentiment & Loyalty Gaps
This is the part of the story that usually makes people laugh, sigh, or both. When you compare how executives think things are going with how customers actually feel, the gap is… generous. Leaders are convinced loyalty is rising, customers are convinced service is slipping, and everyone’s a little shocked when they see the real numbers.
This is exactly where NPS earns its keep. If you’re only looking at internal dashboards, you’ll miss what customers are saying in real time, and by the time the metrics catch up, the damage is already done. These NPS statistics paint a pretty honest picture of just how far apart perception and reality can be.
- 70% of executives say customer expectations are evolving faster than their company can adapt (PwC).
- 64% of customers would prefer that companies didn’t use AI in their customer service (Gartner).
- About 90% of executives say customer loyalty has improved in recent years (PwC).
- 9 out of 10 executives believe customer loyalty has grown in recent years (PwC).
- 57% of executives admit their loyalty systems aren’t delivering results (PwC).
- 46% of executives believe their current loyalty programs will be irrelevant within three years (PwC).
- 29% of consumers stopped using a brand due to poor customer experience (PwC).
- 52% of consumers abandoned a brand after a bad product or service experience (PwC).
- 39% of brands saw meaningful declines in CX Index scores in 2024 (CSG).
- 49% of Americans say customer service has worsened in the past year (CSG).
NPS Industry Benchmarks
If you’ve ever tried to compare your NPS with another brand in a totally different space, you know how wonky that can get. A grocery chain and a life insurance provider don’t exactly play the same sport. This list gives you a clear, apples-to-apples look at how different U.S. industries actually perform, so you know what “good” means for your category instead of chasing some mythical “universal NPS.”
These are the industry NPS statistics from NPS Prism by Bain & Company that actually matter because they show you where customer sentiment sits today, which sectors are winning with experience, and which ones still make people groan on sight.
- In the Auto industry, the best brands score around 81, and the lowest sit near 35 (NPS Prism).
- In Annuities, top performers reach about 73, while the bottom of the category is around 36 (NPS Prism).
- Home and Auto Insurance leaders score roughly 70, while laggards fall closer to 24 (NPS Prism).
- Grocery stores range from about 69 on the high end to –1 on the low end (NPS Prism).
- Life Insurance stretches from 67 at the top to –2 at the bottom (NPS Prism).
- Checking and Savings accounts reach a high product NPS of 60 (NPS Prism).
- Wealth Management firms range from 58 to 17 across the industry (NPS Prism).
- Credit Card companies lead with a product NPS of around 54 (NPS Prism).
- Airlines score as high as 53 and as low as –22 (NPS Prism).
- Utilities range from 36 for leaders down to –31 for laggards (NPS Prism).
Where Most NPS Programs Get Stuck
You’d think that by now, most companies would have NPS figured out. The truth is, a lot of teams are still stuck in the basics. They’re collecting scores, sending surveys, building dashboards, and then quietly wondering why the numbers don’t tell them what to fix. Every CX leader I talk to says the same thing: it’s not the score that’s hard, it’s turning it into something useful.
This is where most NPS programs fall apart. Not because the metric is flawed, but because companies don’t have the tools, alignment, or organizational patience to run it properly. These NPS statistics paint a pretty honest picture of how teams are struggling to measure what matters, connect NPS to actual revenue, and get the buy-in they need to make improvements happen.
- 60% of CX professionals say linking CX metrics to business outcomes is one of their biggest challenges (CSG).
- 84% of executives have increased spending on customer loyalty, even though most still aren’t sure how to measure if it’s working (PwC).
- 83% of executives say they need better tools to understand what’s actually driving customer purchase decisions (PwC).
- By 2027, 60% of service and support leaders will fail to secure funding for their most important projects because they can’t show clear ROI (CSG).
- Fewer than 15% of companies using CX orchestration platforms run even 60% of their customer journeys through them (CSG).
- The C-suite is demanding hard data to justify new CX projects, not soft metrics (CSG).
- The NPS framework’s rapid popularity has led to its misinterpretation and misuse, sowing confusion and diminishing its credibility (HBR).
- 70% of executives think customer expectations are rising faster than their company can keep up (PwC).
- 39% of brands saw significant drops in their CX Index scores in 2024 (CSG).
- Linking scores to employee performance creates incentives for manipulation, including pleading (“I’ll lose my job if you don’t rate me a 10”) (HBR).
FREE. All Features. FOREVER!
Try our Forever FREE account with all premium features!
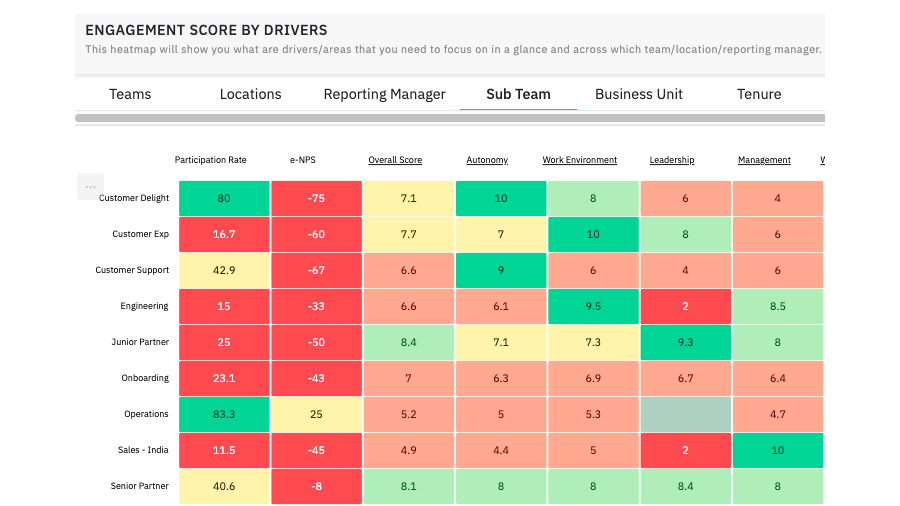
Employee Experience & eNPS Signals
Every CX leader knows this already, but it’s funny how rarely companies admit it out loud: your customer experience is never going to outperform your employee experience. If the team behind the scenes is frustrated, burned out, switching roles, or fighting ancient systems all day, you can bet the customer is going to feel it.
That’s where eNPS becomes such a useful signal. It’s not a vanity score. It’s a pulse check on whether your people have the support and clarity to actually deliver the customer experience you want. When eNPS is strong, customer NPS almost always follows. When it’s weak, you see the cracks show up in onboarding, service, digital journeys — basically everywhere a human touches the experience.
These NPS statistics show how a few industries and brands are using employee sentiment as a real competitive advantage:
- In the Annuities category, USAA has the highest aggregate eNPS and sits 21 points above the industry average (NPS Prism).
- In OTT streaming, Netflix leads the category, with eNPS scores for both human and digital channels that are well above the industry average (NPS Prism).
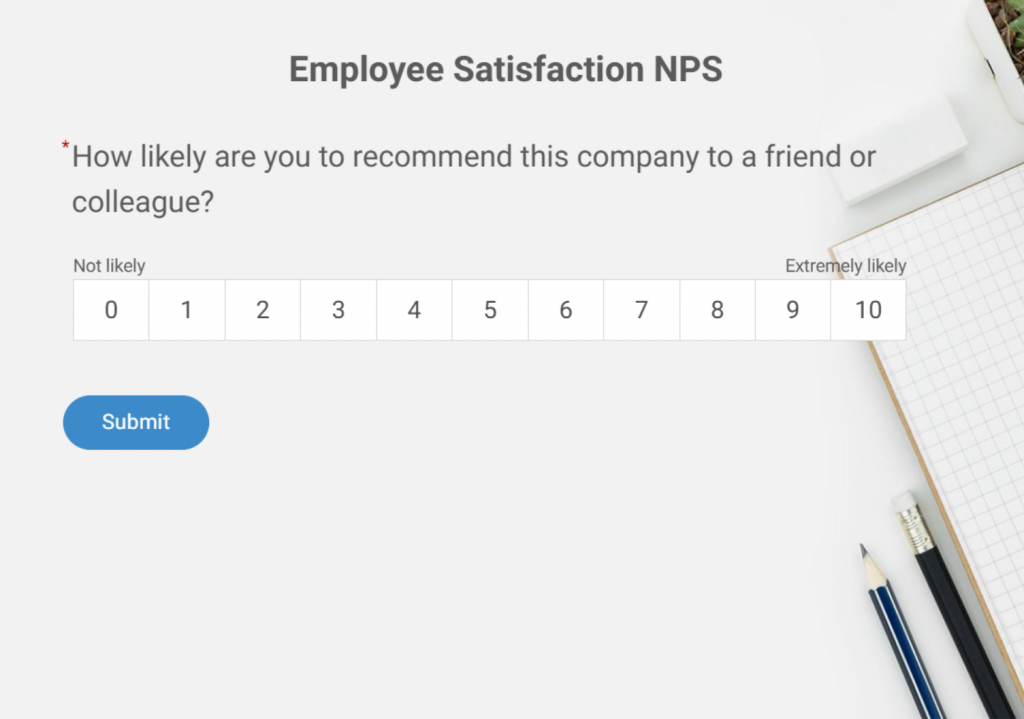
Here’s a quick template to easily setup your eNPS program:
Customer Loyalty Trends CX Leaders Should Pay Attention To
Loyalty isn’t disappearing. It’s just shifting underneath us. Customers are a lot less patient, a lot more informed, and way more willing to switch when something feels even a little off. These are the trends that matter right now: the ones shaping how people score you, stick with you, or walk away.
Customers Want Frictionless, Not Flashy
Most people don’t need wow moments. They just don’t want the experience to get in their way. If your product works the way they expect, if support feels human, and if nothing requires “figuring out,” you’re already ahead. The absolute loyalty win today is reducing effort, not trying to blow people away.
Expectations Are Moving Faster Than Companies Are
Customers evolve faster than roadmaps. They try something smoother elsewhere, and suddenly your experience feels outdated. CX leaders are seeing this gap widen, and the only way to keep up is to treat experience as a living system, one that needs weekly tuning, not a yearly facelift.
Trust Comes From Reliability, Not Marketing
Brands that keep their promises, the product works, the billing is clean, and support actually helps earn trust slowly but deeply. Customers are sharp now. They can sense misalignment instantly, and no amount of marketing can cover inconsistent experiences.
Loyalty Is Now Built In the Mundane Moments
Most of the moments that shape NPS aren’t glamorous. They’re things like checking an order status, resetting a password, or getting an answer from support. When those moments feel smooth, customers stay. When they don’t, they don’t complain; they just leave.
People Want to Solve Problems Themselves
Customers prefer self-service when it’s done right. They don’t want to wait for an agent if they can resolve something quickly on their own. This has put pressure on companies to modernize workflows, clean up content, and design intuitive digital paths.
The Real Meaning Behind NPS: What CX Teams Often Miss
Most teams treat NPS like a scoreboard. Send a survey, collect the number, watch it go up or down, and move on. But the number was never the point. NPS is important and was designed to reveal what needs fixing, not to decorate a slide deck. When companies anchor the conversation around the score instead of the signals behind it, they miss the entire value of the system.
These are the truths that often get lost in the day-to-day of “NPS management.”
| What CX Teams Often Miss | What It Actually Means |
|---|---|
| The score isn’t the point | NPS isn’t meant to be admired. It’s meant to tell you where the experience is cracking so you can fix it. |
| Improvement happens in the messy work | Loyalty grows when teams fix small annoyances, not when they obsess over dashboards. |
| Closing the loop matters more than sending the survey | A quick follow-up, a call, or a resolution can shift sentiment more than a big feature launch. |
| NPS fails when one team “owns” it | Product, support, marketing, and engineering (everyone) play a role in the experience, so everyone has a stake in the score. |
| The comments matter more than the number | The score tells you “what.” The verbatim tells you “why.” The “why” is where all the action lives. |
| Consistency beats big gestures | Customers remember smooth, reliable experiences, not one-time surprises. NPS grows from predictability, not theatrics. |
| NPS is a habit, not a campaign | The companies that win use feedback daily, not quarterly. They build muscle, not moments. |
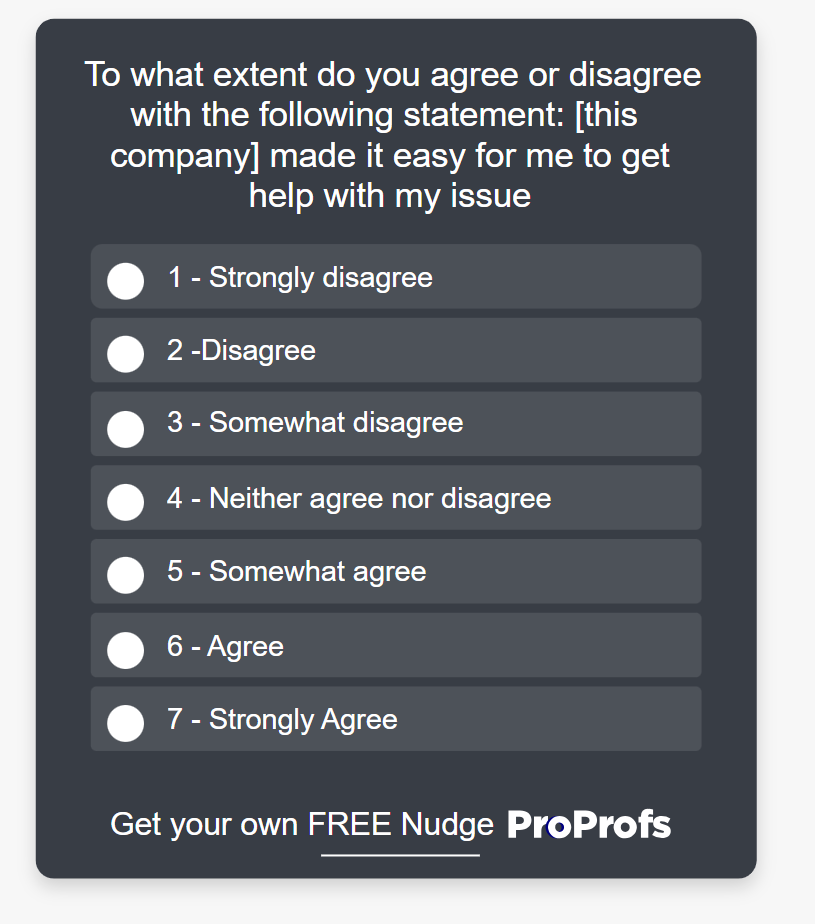
How NPS Tools Actually Help
Most teams don’t struggle with “getting” NPS. Everyone understands the score. What most teams quietly admit is that they have no idea what to do with all the feedback that piles up. I’ve seen teams drowning in comments, manually tagging things, building dashboards that no one opens, and still thinking, “Why does this feel so fuzzy?”
That’s one of the reasons I’ve always liked Qualaroo. It doesn’t wait for customers to wander into a long survey. It catches them in the moment right when they’re actually feeling something, and the responses are so much more real.
You can spin up an NPS survey in a few clicks — literally pick the NPS template, write your one question, and you’re off. It feels like the tool gets out of the way so you can actually learn something. In fact, here’s a quick video to help you create an NPS survey:
And the best part? The follow-up “why?” is baked right into the workflow. You can branch the survey so detractors, passives, and promoters all get different follow-up questions. I’ve seen teams get more insight from a single branching follow-up than they ever got from a 20-question survey.
To help you better, here’s the NPS template you can use to quickly set up your NPS program:

FREE. All Features. FOREVER!
Try our Forever FREE account with all premium features!
How to Think About NPS Going Forward
Customers don’t expect perfection. They expect progress. They want to feel like you’re paying attention, like their voice actually lands somewhere instead of disappearing into a spreadsheet. When you make that kind of listening part of how your company works, the loyalty takes care of itself.
The referrals start to flow. The revenue graphs behave a little better. And you don’t have to guess what customers want. They’ll tell you, if you give them the right moment and the right nudge.If you’re using NPS today, or thinking about tightening up your feedback loops, you’re already on the right path.
The real advantage comes from what you do next: the small, consistent fixes that eventually turn customers into promoters without you ever having to ask.
Frequently Asked Questions

What is the current rate of NPS?
There’s no single “current NPS” across all industries, and anyone who claims there is is probably oversimplifying. Every category has its own range. Some industries top out in the 60s or 70s, while others struggle to break even. The most useful benchmark is always the one inside your industry, not the global average.
Does the NPS score itself matter, or is it all about the follow-up?
The score is just the spark. The real value comes from what you fix afterward. Practitioners agree that without a solid closed-loop process, NPS quickly becomes a vanity metric.
Should early-stage startups even bother with NPS?
Not really, at least not as a core metric. Operators say early-stage teams are better off validating product–market fit, reducing churn, and talking to users directly. NPS becomes powerful once you have enough users to spot patterns.
Why do some companies “game” their NPS, and what’s the harm?
Gaming often occurs when teams prioritize avoiding poor scores over seeking genuine feedback. But manipulating NPS only hides the problems. It kills trust internally, and worse, it blocks the signal you need to grow. Community veterans are blunt about this: “If you delete detractors, you’re just lying to yourself.”
FREE. All Features. FOREVER!
Try our Forever FREE account with all premium features!
 We'd love your feedback!
What did you like & how can we make it even better?
 Thanks for your feedback!
 Ask Your Question
Have a question? Get expert help to make your decision easier.