

Profits and happy customers go hand in hand. And customer satisfaction metrics are the common denominator between the two.
These metrics help you to see what you’re doing right and also find opportunities to improve. This way, you are equipped to offer a better customer experience, which, as we all know, leads to higher customer satisfaction.
Now, we’re not going to discuss all the possible CS metrics there are; that’s a story for another time.
We’ll focus on three distinct CX metrics and compare them: Customer Satisfaction Score, which measures satisfaction with a specific interaction; Net Promoter Score, which measures loyalty and likelihood to recommend; and Customer Effort Score, which measures how easy or difficult it is for customers to complete a task or get help.
Each one captures a different dimension of the customer experience, and understanding that difference is what makes them useful.
So, which one should you track?
Let’s find out.
CSAT vs. NPS vs. CES: Everything You Should Know
The first step towards choosing the right customer satisfaction metrics is to set a goal.
What do you want to find out with the feedback? What will you do with the collected data?
The objective should be crystal clear for everything to make sense.
For instance:
- If you may want to know whether your customers are satisfied enough to recommend your brand to others, NPS is your go-to metric.
- If you wish to measure their satisfaction after a specific interaction, you can send CSAT surveys.
- And if you want to see how easy or difficult your product is to use, you can use CES surveys.
Now, let’s get down to business.
Customer Satisfaction Score (CSAT Score)

What Is CSAT Score?
It is one of the most popular CS measurement tools that help businesses evaluate how satisfied customers are with their products and services.
Customers are asked to rate their satisfaction level in response to a specific question on a scale starting from one (being the lowest) to a predetermined number (say 5, 10, etc.). The higher number signifies a higher level of satisfaction.
Emoji scale is one of the popular choices for measuring customer satisfaction.
What Is a Good CSAT Score?
If your CSAT survey has ratings from 1 to 10, anything from 7 to 10 is considered a good customer satisfaction score.
CSAT is not restricted to numerical scales when evaluating CSAT scores. You can also use emoticons to directly approach users’ emotions without language barriers since emoticons are very expressive and universal.
So in the image, the first two scores from the left indicate happy customers and are considered a good score. Whereas, the last two from the right indicate a low score since customers aren’t happy.

Besides numerical or emoticons, surveyors also use the percentage as a metric, where the same rule of ratings applies.
How Does It Work?
Regardless of how meticulous a business is in making its online presence optimized and effortless, there are always a few loopholes that sneak up later, while users are on the website.
For example, Hootsuite is a well-known social media management platform that helps its customers access all their social media platforms in one place.
Many visitors were aware of its services; nevertheless, the high visitor count would turn into a high bounce rate within minutes of visiting the landing page.
What was Hootsuite doing wrong? Why were visitors not converting into customers, which was disturbing the sales funnel?
Using a CSAT tool like Qualaroo, Hootsuite set up a CSAT survey on its landing page and collected feedback regarding ease of use, relevancy, and overall experience.
It turns out, the landing page itself was not clear enough to paint an accurate picture of how to get started with the service.
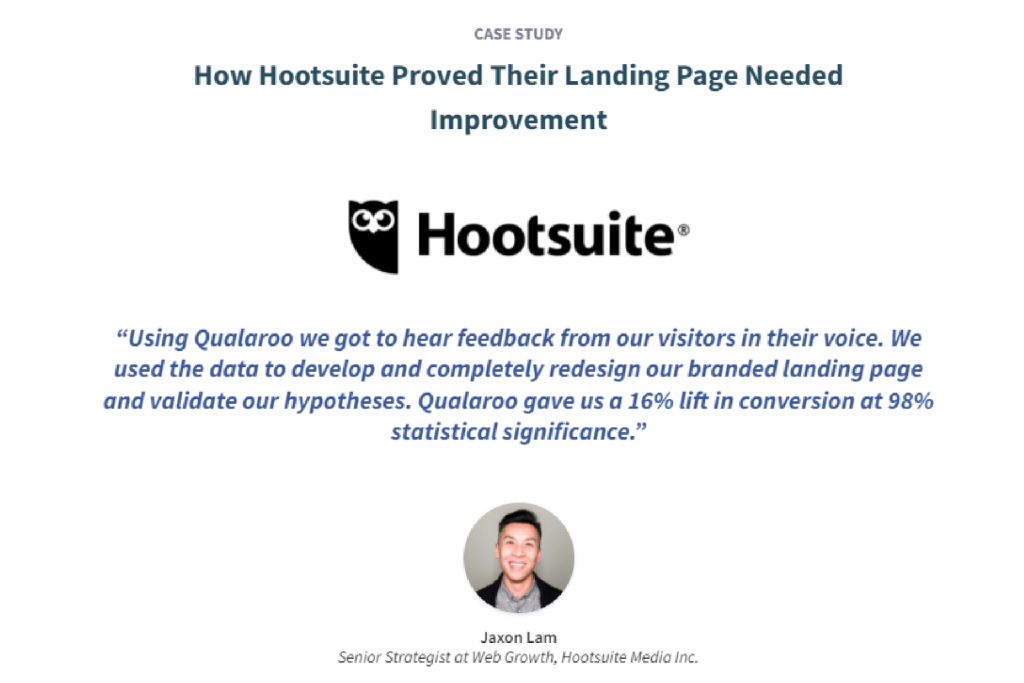
The CSAT survey pertains to one thing in particular – how users would rate the experience and satisfaction with the service/product when the interaction is still very recent.
This way, Hootsuite targeted the CSAT survey at the right place (landing page), at the right time (when the users were active or about to leave), and asked the right questions.
You can read about Qualaroo’s customer success story here.
Pro Tip: It helps if you measure your CSAT score continuously only when you’ve acted on the previous feedback to see if your improvements have been well-received or not.
Questions to Ask in a CSAT Survey
At a basic level, a CSAT survey consists of two types of questions:
- Questions asking customers to rate their satisfaction levels
- An open-ended question follows the first one, asking what the customers liked or what can be improved depending on the rating

Here is a glimpse into the types of questions you can ask on a CSAT survey:
- Did this page meet your expectations? (If not, using the branching approach, you can gather context for this feedback with open-ended questions)
- How would you rate your overall experience on our site today?
- What do you think we could have done better?
- What do you think we should improve in our checkout process?
For more ideas, visit and bookmark this survey question library.
You can always edit and customize your questionnaire according to your purpose, i.e., customer journey, product, last interaction, and more.
When to Deploy a CSAT Survey?
To get the most optimum results, it is best to conduct a CSAT survey when the customer experience is still new and fresh for customers.
If you wait too long to ask for their feedback, it is possible that they might miss minor details over time and not give you accurate feedback on their true experience. They might not even take the survey for an event that had long passed.
You should conduct a CSAT survey when you need to get insights into some crucial areas such as:
- Sales interaction
- Customer support interaction
- To gauge overall customer sentiment
- To gather feedback on any event or conference
- Customer onboarding
- Product and sales satisfaction
- Checkout process and more
How to Calculate the CSAT Score?
Because CSAT surveys are very clear, straightforward, and simple in their approach, it is relatively easy to calculate the CSAT score.
For CSAT calculation, all you need is to divide the number of positive responses by the total number of responses and multiply their result by 100. You will get your CSAT score in percentage. Here is how:
Assume:
Total number of responses – 70
Number of positive responses – 42
Then: 42/70 X 100
Hence, you get a 60% CSAT score.
Net Promoter Score (NPS)
What is NPS?
NPS measures a different dimension of customer experience than CSAT. Where CSAT captures how a customer felt about a specific interaction, NPS measures their overall loyalty to your brand and their likelihood to recommend you to others. The two metrics complement each other rather than compete.
Think of it as a growth indicator that tells you how likely customers are to recommend you to their friends, family, and acquaintances.
NPS, again, is a prevalent metric to analyze the churn rate of customers. It helps brands identify which customers need the boost to tip them towards the scale of loyalty.
What Is a Good NPS?
Speaking of a good NPS score, anything above 0 is considered a good score. Why? It shows that some of your users are loyal. If you score above 20, it can be seen as a ‘favorable score.’ A score above 50 is a ‘very good’ one, and anything above 80 is ‘Excellent.’
How Does NPS Work?
NPS surveys are very concise. Generally, an NPS survey has the NPS question followed by a few contextual ones to understand the reason behind customers giving low scores. You can send NPS surveys at any stage in the customer journey via channels like pop-ups, SMS, e-mails, and more.
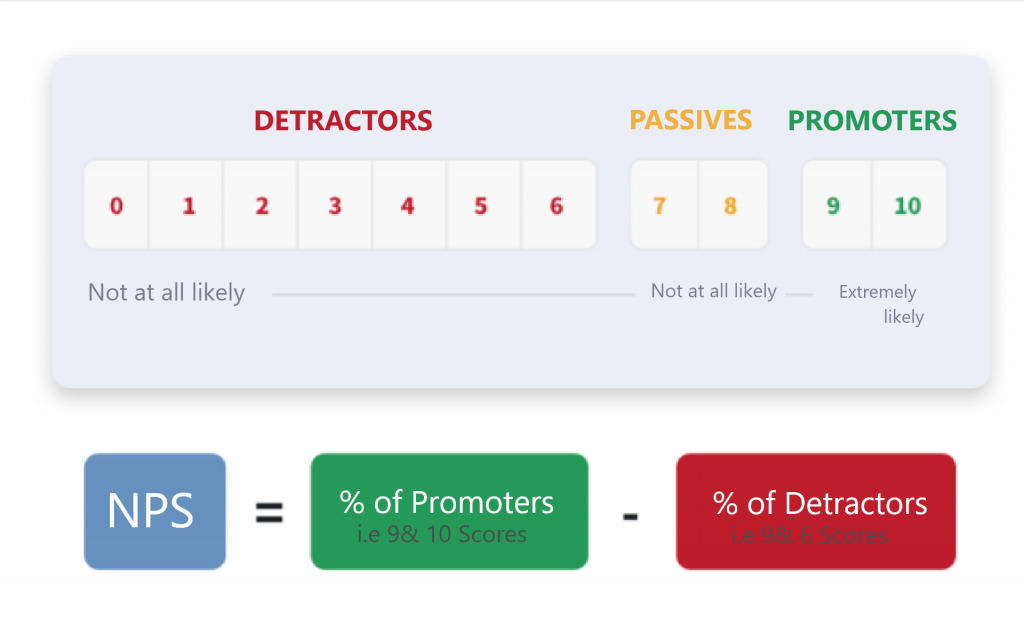
NPS uses an 11-point scale from 0 to 10. Respondents who score 0 to 6 are classified as detractors, those who score 7 or 8 are passives, and those who score 9 or 10 are promoters. The final NPS is calculated by subtracting the percentage of detractors from the percentage of promoters.
Questions to Ask in an NPS Survey
Here is the most basic example of an NPS question:
“On a scale of 0 to 10, how likely are you to recommend our product/service to others?”
When to Deploy an NPS Survey?
You can schedule NPS pop-ups to appear at certain times with advanced targeting, such as (and more):
- After a purchase/signup for a trial
- After a customer connects with the support team
- When a certain action is taken on the website
- Prior to the end of the subscription
You can ask your first-time customers about their experience, existing customers at random intervals (say after six months), and at many such instances to gauge user feedback.
How to Calculate NPS Score?
It is straightforward to calculate the NPS score if you have an easy-to-use and useful feedback collector tool. Here is how to measure NPS:
For example, if you survey 100 customers and get the following responses:
Promoters (scored 9-10): 60 customers
Passives (scored 7-8): 20 customers
Detractors (scored 0-6): 20 customers
You would calculate the NPS as follows:
NPS = (60% – 20%) = 40
Read More: Best Net Promoter Score Survey Software & Tools
Customer Effort Score (CES)
What is CES?
CES refers to the level of customer satisfaction based on the amount of effort they had to put to avail of your services or complete a task on your website.
You can say CES is more specific when it comes to targeting customer satisfaction. It only focuses on one aspect of CX – customer efforts.
One of the essential ingredients in the recipe for customer satisfaction is to reduce the time and efforts customers have to invest in doing business with you.
With the help of CES customer satisfaction metrics, businesses can quickly identify how easy their process is for customers. If the overall feedback shows negative results, companies can eliminate this issue and even take proactive measures in the future.
What Is a Good CES Score?
For the CES score, there are no definitive industry standards set in place to assign ‘good’ or ‘bad’ quality to a score. However, it is generally believed that a score of 5 and above on a scale of 7 is an excellent score.
According to the Corporate Executive Board (CEB), uplifting a customer from 0 to 5 on a scale of 7 can boost users’ loyalty by 22%. Whereas moving a customer from 5 to 7 only increases loyalty by 2%.
How Does CES Work?
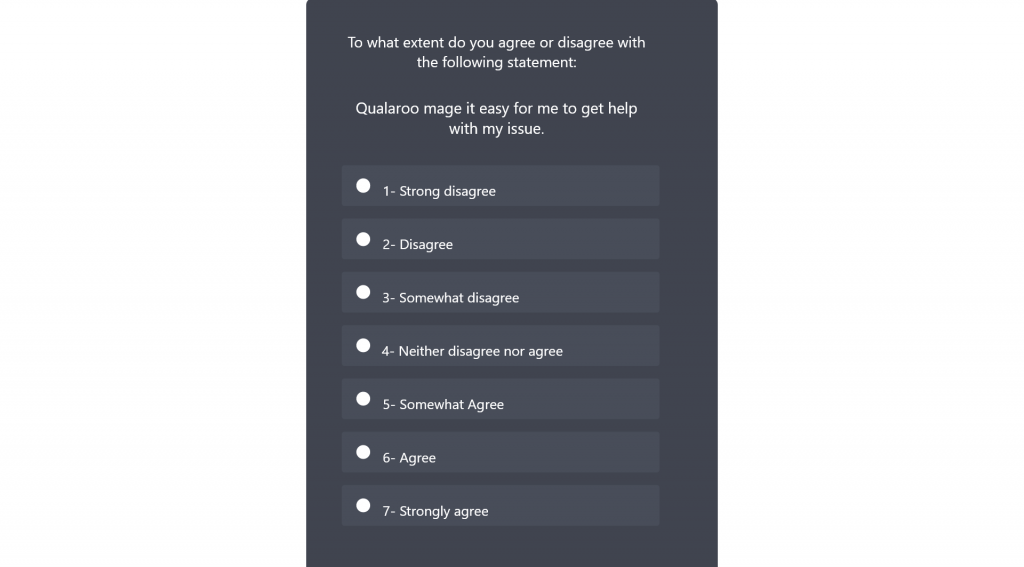
It is probably the simplest metric out of all. It generally consists of one simple question gauging the level of effort users had to put while doing business with a brand. A statement is provided along with different options ranging from strongly disagree to strongly agree.
Customers can choose between the options given in the survey. For instance, in the above template, customers can choose from the lowest score of 1 (strongly disagree) to 7 (strongly agree).
It provides direct feedback on what customers are experiencing with the brand.
Questions to Ask in a CES Survey
Under CES metrics, the questions differ from the other two metrics. To help you out even more, here are some basic but on-point questions you can ask your customers in a CES survey:
- What do you think we should improve in our checkout process?
- On a scale of 1 – 10, how would you rate our service?
- To what extent do you agree or disagree with the following statement:
- [Company name] made it easy for me to get help with my issue.
- [Company name] made it easy for me to find a solution to my issue.
- Is there anything we can do to make our service more useful?
- Was this help section useful?
- Did you find the information you were searching for?
{While we are reading about CES, here is some more information about the difference between CES and UES (User Effort Score)}
When to Deploy a CES Survey?
Businesses generally consider using a CES survey right after a customer service or a product/service touchpoint. For instance, you should consider a CES survey once a user:
- Signs up for a free trial
- Has had interactions with customer support/success
- Completes a certain task related to your product
- Accesses information from your business
You can gather some real-time feedback this way if you ask the question right after the event. In that way, CES is great at collecting real-time feedback.
CSAT vs. NPS vs. CES: Get the Best of All Worlds With Qualaroo
To ace your CSAT, NPS, and CES surveys, you need to have remarkable customer satisfaction measurement tools to assist you.
Choose a tool that not only effectively collects the customers’ feedback at the right place, at the right time, and with the right set of questions, but also analyzes and categorizes the data for better understanding.
Here are some preferred and trusted customer feedback tools that help you evaluate customer satisfaction metrics.
CSAT vs. NPS vs. CES: A Side-by-Side Comparison
| CSAT | NPS | CES | |
|---|---|---|---|
| Basic Questions | "How would you rate your overall satisfaction with our product?" | On a scale of 0 to 10, how likely are you to recommend our product or service to others? | "How easy was it for you to get a solution to your problem?." |
| Measurement Scale | Numerical rating scale (e.g., 1 to 5 or 1 to 10), emoticon scale, or percentage of positive responses. | 11-point scale from 0 to 10. | Strongly disagree, Disagree to Agree/ Strongly agree. |
| Purpose | To analyze the overall customer satisfaction with the services and products. | To identify how likely your customers are to recommend your company to others. Helps identify promoters, passives, and detractors. | To gauge the level of users' effort needed to complete a task. |
| Methods to calculate | CSAT = Number of positive responses / Total number of responses X 100 | NPS = % of promoters - % of detractors | CES = Sum of all Customer Effort scores/total number of respondents. |
When Should You Use CSAT vs. NPS vs. CES?
Knowing what each metric measures is only half the question. The more practical question is when each one gives you reliable, actionable data.
Use CSAT immediately after a specific interaction. CSAT is designed to capture how a customer felt about a recent, bounded experience: a support resolution, a product purchase, a sales call, or an onboarding session. It degrades quickly. The longer you wait after the interaction to ask, the less accurate and useful the response becomes. Deploy it while the experience is still fresh, typically within minutes or hours.
Use CES right after an effort-heavy touchpoint. CES is the right metric when you want to know whether a specific process was easy or frustrating: completing a return, resolving a billing issue, navigating a setup flow, or finding information in a help center. Like CSAT, it performs best close to the moment. It is not suited for measuring overall satisfaction or long-term loyalty.
Use NPS for relationship-level tracking at set intervals. NPS measures how a customer feels about your brand overall, not in response to one moment. That makes it most useful when sent on a regular cadence, quarterly or biannually, to a representative sample of your active customer base. Avoid triggering it immediately after a single interaction, since a recent bad experience or an unusually good one will skew the score away from the relationship-level signal NPS is designed to capture.
A quick decision guide:
| If You Want To Know… | Use This Metric |
|---|---|
| How satisfied was this customer with our support interaction? | CSAT |
| How easy was it to complete this task or get help? | CES |
| How loyal is this customer to our brand overall? | NPS |
| Whether a recent change improved the experience? | CSAT or CES, depending on the touchpoint |
| Which customers are at risk of churning? | NPS segmented by tenure and plan tier |
FREE. All Features. FOREVER!
Try our Forever FREE account with all premium features!
Benefits of Measuring NPS, CSAT, and CES
Tracking these metrics consistently gives teams something concrete to act on, across support, product, and marketing. Here’s where each one delivers the most value.
Lower Your Churn Rate
Also known as the rate of attrition, it’s the rate at which customers abandon a business entity’s services. The question is, why would customers stop doing business with a company?
A survey by ThinkJar states that as much as 67% of customers churn based on their bad experiences with organizations. In which case, with customer satisfaction measurement tools, you can identify how many customers have had unpleasant experiences and how. This way, you can find out how high your churn rate is and what factors are causing it.
Once identified, it becomes easy to develop actionable strategies (big or small) to improve CX aspects.
Help Ace Your Marketing Strategy
It is imperative for every business to have a clear vision of where they should invest their capital for the best results.
For instance, as much as it is essential to invest in marketing channels, it is necessary to know which marketing channels are worth it. A business may target 4 to 5 different marketing platforms, but only a few might drive customers.
To that end, customer satisfaction survey metrics will help you gather data from which marketing channels they found about your brand. It is the best way to reallocate the advertising budget strategically.
Case Study: Udemy
A reputable platform like Udemy also went through the same situation to figure out the most active marketing channels for funds reallocation.
Watch this video to learn how customer feedback helped Udemy learn the effectiveness of their advertising spends across different locations.
The learning platform could also make product optimizations based on its users’ customer satisfaction survey responses.
Read in detail about how they did it here.
Weapon to Battle Competition
Gartner’s report on Customer Experience Survey mentions that two-thirds of marketers accountable for CX believe they compete based on their company’s CX.
It signifies that CX is the latest trend or rather a tool to compete against the competitors. Why? Because that is what customers demand.
Previously, customers used to rate companies based on their products and services. But this shift towards prioritizing experience now is something that should not go unnoticed by companies if they want to stand the tides of cut-throat competition.
Word of Mouth Is More Efficient Than Any Campaign
It’s not surprising that according to a HubSpot survey, a staggering 81% of customers prefer to trust recommendations from friends and family instead of a brand.
Hence, as many efforts as you may pour into grand marketing with many a remarkable copy, one bad word of mouth can quickly turn a dozen more potential customers towards your competitors.
Therefore, if you continuously track customer satisfaction ratings, you can pinpoint customers’ pain points, resolve them, and create a memorable experience for your users.
Helps Predict Your Business Performance
Metrics like NPS can serve as useful leading indicators when tracked consistently over time. A declining NPS score among a high-value segment, for example, often warrants closer investigation into retention risk.
However, NPS should be interpreted alongside behavioral and operational data, such as product usage, support ticket trends, and actual churn rates, rather than treated as a standalone predictor of revenue or customer behavior.
For example, if a high-value customer gives you a low rating, say 3, in an NPS survey, you can be proactive by adding a follow-up question asking the reason behind the poor rating.
This way, you can:
- address the reasons for their dissatisfaction,
- turn the bad experience into a happy one,
- prevent churn,
- and tell customers that you care.
NPS vs. CSAT vs. CES: The Bottom Line
To sum up, NPS, CSAT, and CES are three robust customer satisfaction metrics that measure different aspects of customer experience: loyalty, satisfaction, and effort.
By tracking them together using surveys, you can comprehensively understand your customers’ needs, preferences, and pain points.
Think of these as your three infinity stones in the customer experience gauntlet. Using each individually is powerful, but all three together can completely overhaul your customer experience.
You can also identify the areas where you excel and need to improve. It will help you create happy customers who stay with you longer, buy more from you, and refer you to others.
Frequently Asked Questions
What is Customer Experience (CX)?
By definition, Customer Experience results from the interaction between a customer and an organization. It is typically what a user feels towards a company, based on the quality of experience upon engaging with a brand.
It starts from the first interaction until the customer completes their purpose with the brand. CX is explicitly related to CS since the former is the basis for measuring the latter.
CX is one of the most prominent components of any business. A report by PwC states that 86% of the customers are likely to spend more for a better customer experience. So, if customers value CX so much, how can businesses afford to neglect it?
Can you convert NPS to CSAT?
These are two different metrics and are not interchangeable. NPS measures customer loyalty and advocacy, typically using a scale from 0 to 10, while CSAT gauges immediate satisfaction, typically on a 5-point scale. You can't convert one into the other, as they assess different aspects of customer feedback. However, you can use both metrics for a more comprehensive view of customer sentiment.
CSAT vs NPS: Which is best?
Both are essential customer satisfaction metrics that help businesses understand the overall customer experience and what needs to be improved.
What is the best metric to track customer satisfaction?
There isn't a one-size-fits-all answer to the best metric for tracking customer satisfaction. It depends on your business goals and the type of feedback you seek. NPS, CSAT, and Customer Effort Score (CES) are commonly used metrics offering unique insights.
What 3 metrics best measure customer success?
The three key metrics for measuring customer success include Net Promoter Score (NPS) for loyalty and advocacy, Customer Satisfaction (CSAT) for short-term satisfaction, and Customer Effort Score (CES) to assess the ease of interactions.
Why is CSAT important in customer service?
It helps identify areas for improvement, track service quality, and gauge customer sentiment. High CSAT scores indicate satisfied customers, fostering loyalty and positive word-of-mouth. It's a valuable tool for ensuring consistent, high-quality customer service and enhancing overall customer experience.
What is the CSAT 5-point scale?
The CSAT 5-point scale is a commonly used rating system for customer satisfaction. Customers are typically asked to rate their satisfaction with a product, service, or interaction on a scale of 1 to 5, with 1 being very dissatisfied and 5 being very satisfied.
FREE. All Features. FOREVER!
Try our Forever FREE account with all premium features!
 We'd love your feedback!
What did you like & how can we make it even better?
 Thanks for your feedback!
 Ask Your Question
Have a question? Get expert help to make your decision easier.