

Most teams approach market research the wrong way. They pick a market research tool, run a survey, and wait. By the time results arrive, the product decision has already been made based on gut feel, and the data ends up in a folder no one opens.
Here is what this guide covers:
- 10 market research tools matched to specific use cases
- Honest pros, cons, and current pricing for each
- A three-layer stack framework to stop tool-hopping
- A seven-step workflow so the tools you choose actually connect to decisions
One of these market research tools is Qualaroo, which earns its spot at the top because it solves the problem most teams struggle with most: getting feedback at the exact moment a user is experiencing your product, not days later when the context is gone.
What Is a Market Research Tool?
A market research tool is software that helps you systematically collect, analyze, and act on information about your customers, competitors, or market.
The best platforms do this continuously rather than on a schedule, using behavioral triggers, AI-powered analysis, and direct integrations into the systems where decisions actually get made.
The shift worth understanding: market research used to mean quarterly surveys and annual reports. Today, the expectation is that you know what users think within hours of their experience, not at the next planning cycle.
The 10 Best Market Research Tools
Here is a quick comparison before we go deep on each tool:
| Tool | Best For | Starting Price | Rating |
|---|---|---|---|
| Qualaroo | In-product, real-time research | $19.99/month | 4.7/5 (Capterra) |
| Hotjar | Behavioral data and session analysis | $79/mo | 4.3/5 (G2) |
| UserTesting | Moderated and unmoderated user studies | Custom | 4.4/5 (G2) |
| Qualtrics | Enterprise-scale survey research | Custom | 4.3/5 (G2) |
| Typeform | Lead qualification surveys | $28/mo | 4.5/5 (G2) |
| Similarweb | Competitive website intelligence | Custom | 4.5/5 (G2) |
| BuzzSumo | Content performance research | $199/mo | 4.5/5 (G2) |
| AnswerThePublic | Consumer query research | $6.67/mo | 4.5/5 (G2) |
| Statista | Statistical data and market sizing | $199/mo | 4.4/5 (G2) |
| Google Trends | Free trend spotting | Free for Google Workspace users | 4.6/5 (G2) |
Each tool below is reviewed against the same criteria: what it does well, where it falls short, and who it is actually built for. The goal is not to rank them by popularity but to match them to the situation you are in right now.
1. Qualaroo: Best for In-the-Moment, In-Product Research
Qualaroo has been my go-to for in-the-moment feedback for years, and it is the one tool that actually feels built for product teams who move fast.
The star of the show is the Nudge™, small, non-annoying surveys that appear when someone is on your site or app, right when they are doing the thing you want to learn about. Plus, there are 100+ templates you can tweak and use for easy feedback.
Target them to users who just failed onboarding, paid customers, or any segment you can define. AI-powered sentiment analysis turns thousands of open-text responses into themes you can act on in minutes, and branching works intelligently so users are never hit with irrelevant follow-ups.
Best For: Businesses and enterprises seeking actionable, real-time user insights by surveying visitors on their website, app, or prototypes at the exact moment of interaction.
Pros:
- Built-in AI-driven sentiment analysis with word clouds and mood metrics built into the reporting layer
- Advanced targeting based on identity, custom properties, behavior, geolocation, exit intent, and more
- Visualization and heatmaps
- Nudge™ for prototypes on Figma, Adobe XD, InVision, and more
- Branching and skip logic for contextually relevant questions
- Multilingual surveys in over 70 languages
- Customizable branding, colors, and logo
- In-app surveys for iOS and Android
- Seamless integrations with CRMs, CMSs, and more.
Cons:
- Dedicated onboarding and account manager services are generally reserved for paid plans
- No downloadable or on-premise version available (an internet connection is required)
User Rating: 4.7/5 (Capterra)
Pricing: Free plan available with all premium features. Paid starts at $19.99/month, followed by Business at $49.99 and Enterprise at $149.99.
Verdict: The strongest pick for any product or growth team that needs in-context feedback without engineering support. Start on the free plan and upgrade only when your survey volume demands it.
Case Study: Hootsuite

Hootsuite’s branded landing page was getting strong organic search traffic but not converting. The team suspected the page was not explaining the product clearly enough. They needed data before committing to a full redesign.
Using Qualaroo on-page surveys, Hootsuite asked visitors: “Does this page give you enough information to make a decision?” Around 65% said no. That single data point confirmed the hypothesis and justified a redesign with clearer messaging, plan comparisons, and use-case-specific testimonials.
Result: A 16% increase in conversions, driven entirely by direct user feedback collected at the moment of decision.
2. Hotjar: Best for Behavioral Data and Session Analysis
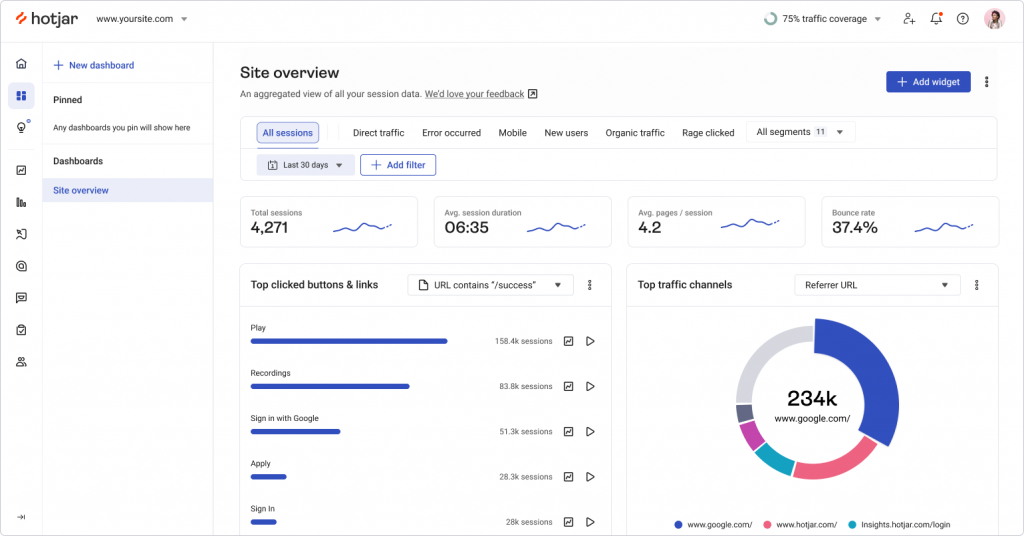
Hotjar came into my stack the usual way: a drop-off nobody could explain, and we needed to see what was actually happening rather than guess. Session recordings showed exactly where users got stuck within a day of setup, and it was not where anyone expected.
Heatmaps show where attention goes. Recordings show the exact wrong turns users take. You stop asking users what they do and start watching them do it.
Best For: UX and CRO teams who need to see what users actually do on a page, not just what they report in a survey.
Pros:
- Heatmaps (click, scroll, and move) across any page without developer involvement
- Session recordings that capture real navigation paths, rage clicks, and dead ends
- Funnel analysis to pinpoint exactly where users drop off across multi-step flows
- Exit-intent feedback polls and on-page survey widgets targeted by segment or time on page
- Form analytics showing which fields users skip, return to, or abandon
Cons:
- Can affect page load speed if not configured carefully, particularly on slower connections
- At high traffic volumes, Hotjar samples data rather than capturing every session
User Rating: 4.3/5 (G2)
Pricing: Starts at $79/month.
Verdict: Essential for any team with unexplained drop-offs or conversion problems. Skip if your primary need is attitudinal data; Hotjar tells you what users do, not what they think.
3. UserTesting: Best for Moderated and Unmoderated User Studies
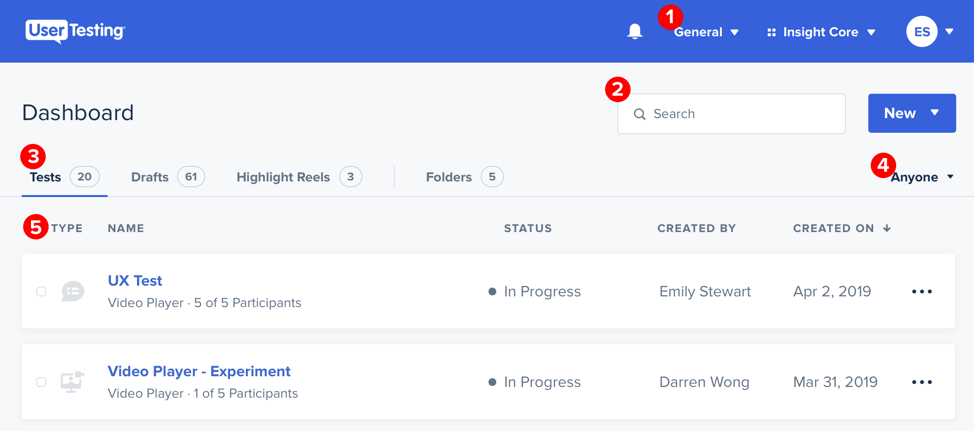
UserTesting was the first tool I used when a product team needed fast qualitative data on a prototype before a stakeholder review with very little runway. Video sessions from real users came back within hours, and AI-assisted theme detection saved what would have been a full day of manual analysis.
It gives you access to a large global panel for moderated interviews, unmoderated task tests, and concept testing, with pre-built templates that make setup fast, even for non-researchers.
Best For: Research teams running structured usability tests with real users, particularly before feature launches or major redesigns.
Pros:
- Video-based moderated and unmoderated studies with a large, globally distributed panel
- Real-time feedback loops for continuous monitoring of user expectations across product versions
- AI-powered theme detection that surfaces patterns across multiple sessions without manual tagging
- Customizable testing workflows, including card sorting, prototype testing, and concept validation
- Comprehensive security and compliance features for teams handling sensitive research data
Cons:
- Not ideal for quick, informal feedback due to the study setup and participant recruitment time
- Occasional technical issues during live moderated sessions
User Rating: 4.4/5 (G2)
Pricing: Contact sales for a custom plan.
Verdict: The right call before any major launch or redesign where you need video evidence from real users. Too heavyweight for quick, informal pulse checks.
4. Qualtrics: Best for Enterprise-Scale Survey Research
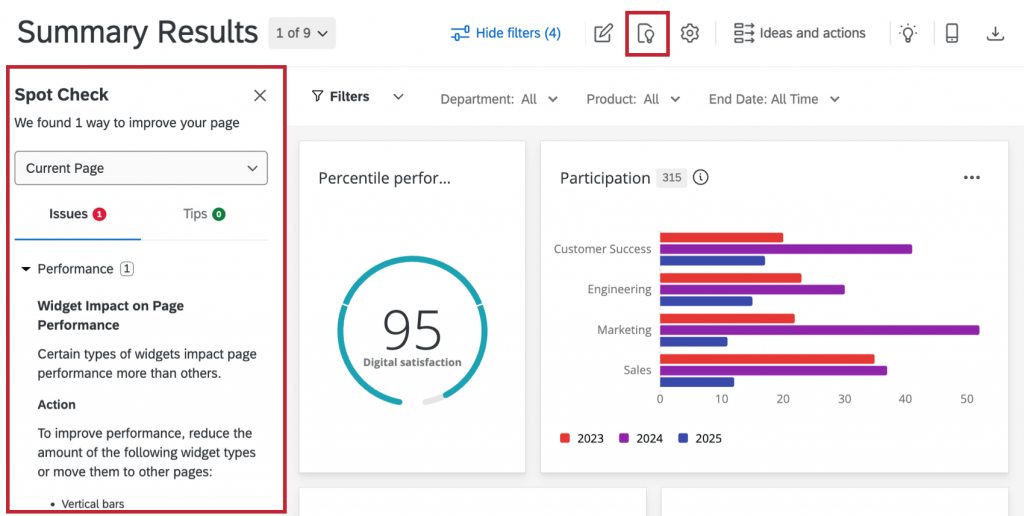
A colleague who runs research programs for a global financial services firm summed up Qualtrics perfectly: “Everything else we tried fell apart at the complexity we needed.” That is exactly what it is built for.
It handles multi-domain feedback programs spanning customer, employee, product, and brand research in one platform, with conjoint analysis, driver analysis, and predictive intelligence built in, not bolted on.
Best For: Large enterprises running complex, multi-program feedback operations that need statistical depth and cross-domain data modeling.
Pros:
- Advanced analytics, including conjoint analysis, driver analysis, and statistical significance testing
- Multi-domain programs covering customer, employee, product, and brand in one unified platform
- Predictive intelligence and trend modeling are built into the reporting layer
- Extensive security and compliance certifications, including SOC 2, ISO 27001, and FedRAMP
- Automated actions triggered by survey responses to close the loop without manual follow-up
Cons:
- Enterprise pricing puts it out of reach for most teams without a dedicated research budget
- Steep learning curve. Even experienced researchers take time to become fully fluent.
- Setting up for complex survey programs is time-intensive
User Rating: 4.3/5 (G2)
Pricing: Custom. Contact sales for a quote.
Verdict: Built for enterprise research programs running at real scale. Overkill for teams under 200 people and a poor fit for anyone without a dedicated research budget and a trained admin.
5. Typeform: Best for Lead Qualification and Conversational Surveys
Typeform showed up in a marketing Slack thread when someone posted a lead-gen form with a 60% completion rate, and everyone asked the same thing: how? The answer was always Typeform.
It’s one-question-at-a-time format turns a survey into a conversation, and conditional logic means a first-time visitor and a power user get completely different question paths without you building two separate surveys.
Best For: Marketing and sales teams running lead qualification surveys, customer discovery interviews, or onboarding feedback distributed via email, landing pages, or social channels.
Pros:
- Conversational one-question format that significantly reduces abandonment on longer surveys
- Conditional logic and branching that adapts the path based on previous responses
- Strong integrations with HubSpot, Salesforce, and Mailchimp for seamless lead data handoff
- Clean templates for fast setup across NPS, product feedback, and event registration use cases
- Robust reporting dashboard with built-in data analysis tools
Cons:
- Limited for complex data processing or advanced research methodologies
- Data export format options are restricted on lower-tier plans
User Rating: 4.5/5 (G2)
Pricing: Starts at $28/month, billed annually.
Verdict: The best option for marketing and sales teams distributing surveys outside the product. Not the right tool if your goal is in-context behavioral research or statistical depth.
6. Similarweb: Best for Competitive Website Intelligence
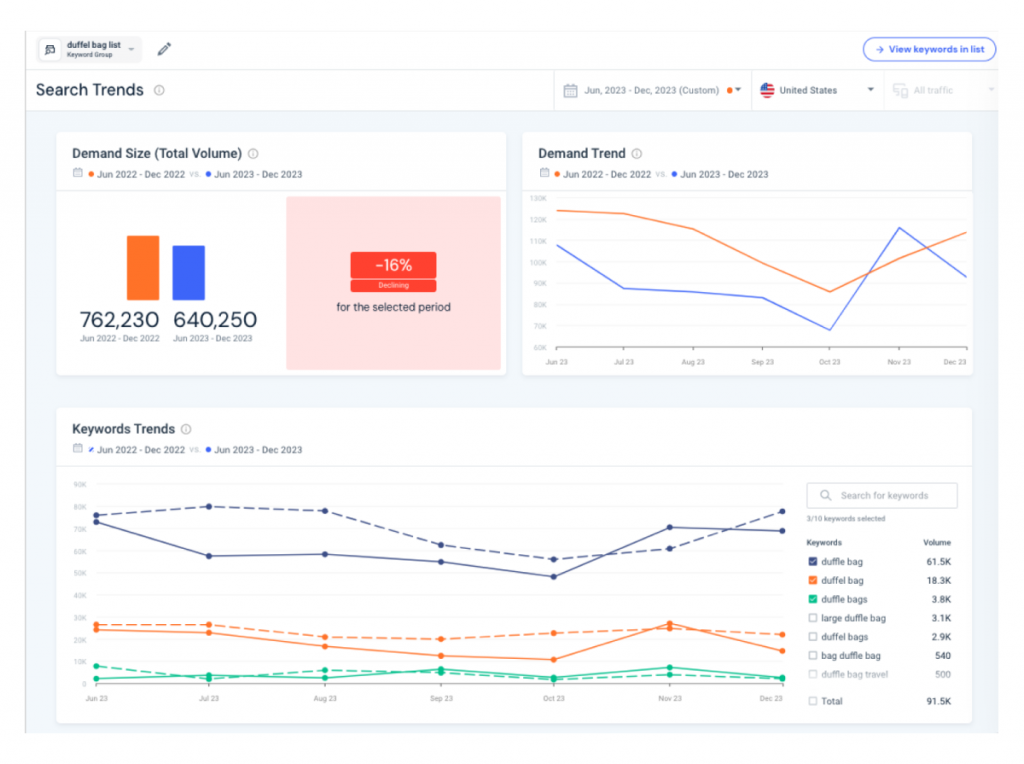
Similarweb came up during a competitive teardown when a growth strategist pulled it up mid-conversation. In ten minutes, we could see where three competitors got their traffic, which keywords they ranked for, and how their audience compared to ours.
It answers the question internal data never can: what is happening outside your own walls, without needing access to anyone else’s analytics account.
Best For: Growth and strategy teams who need to benchmark traffic performance against competitors and identify gaps in channel, keyword, or audience strategy.
Pros:
- Competitor traffic analysis covering sources, channel mix, and top-performing pages
- Keyword analysis spanning both SEO and paid search strategies with ranking data
- Audience demographics and engagement metrics for any website, not just your own
- Market share tracking and industry trend monitoring over time
- Custom dashboards for ongoing monitoring across multiple competitor domains
Cons:
- Costs scale quickly as you add competitors or require more detailed historical data
- Historical data depth is limited compared to some specialized competitive intelligence tools
User Rating: 4.5/5 (G2)
Pricing: Contact sales for pricing.
Verdict: A must-have for any growth or strategy team that needs external benchmarks. Worth the cost if you are actively tracking competitors; hard to justify if competitive analysis is a quarterly afterthought.
7. BuzzSumo: Best for Content and Social Performance Research
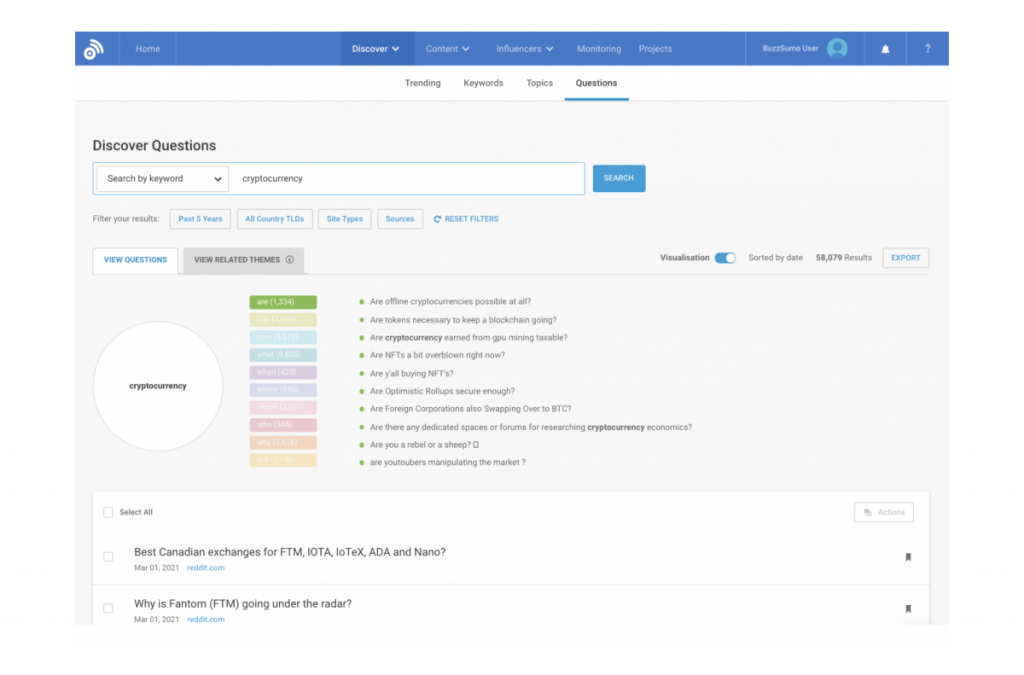
BuzzSumo came up on a marketing forum where someone asked how to find out what topics actually performed before spending weeks writing content nobody reads. It was the answer in nearly every reply.
It shows what audiences care enough about to share, which influencers amplify content in your space, and how your content stacks up against competitors. Keyword volume tells you what people search for. BuzzSumo tells you what they actually engage with.
Best For: Content, SEO, and brand teams who need to understand what resonates with a specific audience before committing to content production or campaign strategy.
Pros:
- Most-shared content analysis across major social platforms by topic, domain, or keyword
- Detailed backlink data showing who is actively promoting content in your niche
- Content filters by date range, language, region, and content format
- Influencer identification to find who drives amplification in your specific market
- Competitor content analysis showing what topics and formats generate the most engagement
Cons:
- More focused on content performance than broader market trends or consumer behavior analysis
- Historical data beyond 12 months is only available on higher-tier plans
User Rating: 4.5/5 (G2)
Pricing: Starts at $199/month, billed annually.
Verdict: Worth it for content and SEO teams who publish regularly and need to validate topics before investing. Skip if your content output is low or your research needs go beyond social performance.
8. AnswerThePublic: Best for Consumer Query Research
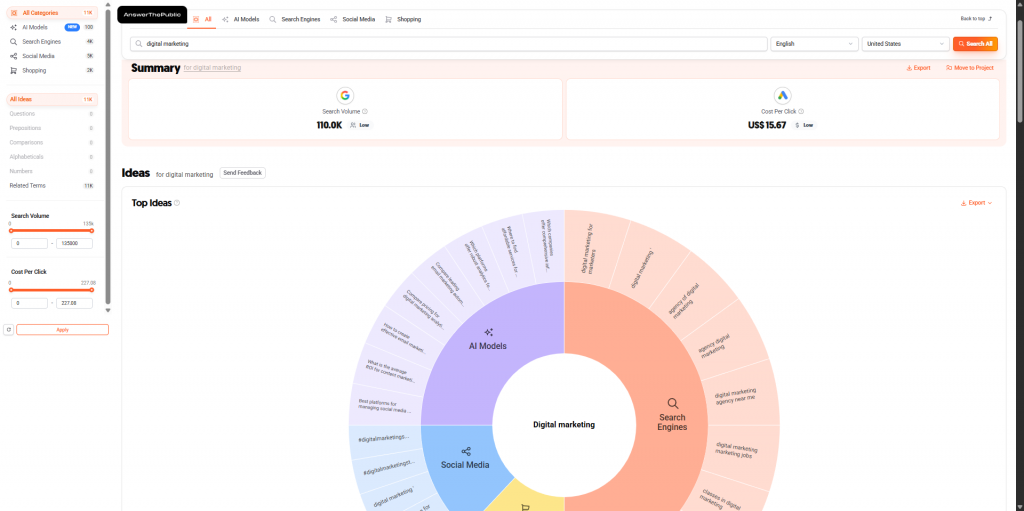
AnswerThePublic showed up in a content planning session when a colleague pulled it up to show what questions people were already asking in our product category. It was one of those moments that makes you realize how much messaging had been based on assumptions.
It maps Google and Bing search queries into questions, comparisons, and prepositions, giving you the exact language your customers use to describe the problem you solve.
Best For: Content, SEO, and product teams who need to understand how potential customers phrase their problems and questions before building content, positioning, or product copy.
Pros:
- Visual search query mapping organized by questions, prepositions, and comparisons for any keyword
- Identifies consumer concerns and comparisons that reveal underlying purchase intent
- Supports multiple regions and languages to tailor research for different markets
- Quick CSV export for use in content planning, keyword strategy, or messaging work
- Free tier available for low-volume research needs
Cons:
- Focuses on keyword-based queries and does not provide broader market trend data or audience demographics
- Does not integrate natively with other marketing tools, so data management is manual
User Rating: 4.5/5 (G2)
Pricing: Starts at $6.67/month, billed annually. Free tier available.
Verdict: An underused starting point for messaging and content work. Pair it with Google Trends for a free, fast validation layer before you commit to any topic or positioning angle.
9. Statista: Best for Statistical Data and Market Sizing
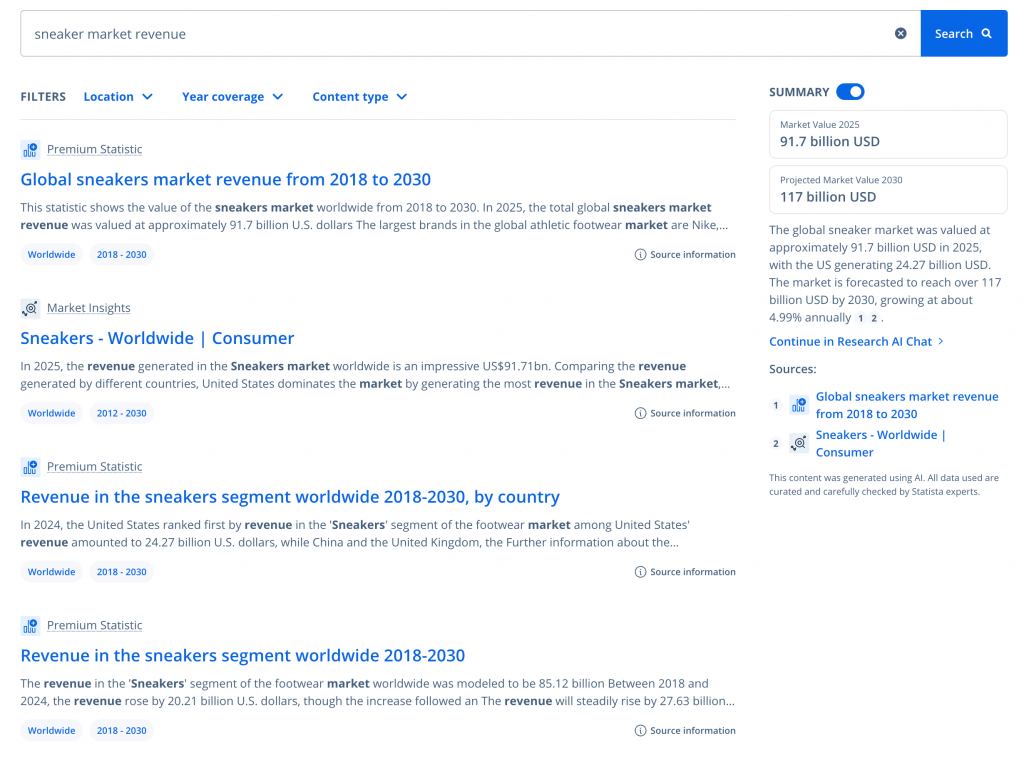
A consultant introduced me to Statista mid-presentation when he needed a credible market sizing number fast. He pulled a chart, cited the source, and moved on in under thirty seconds. That is the whole pitch.
It aggregates statistics, forecasts, and reports from over 22,500 sources into one searchable database, so you stop losing hours hunting for a citable number.
Best For: Strategy, finance, and marketing teams who need verified statistical data to support market sizing, competitive positioning, or executive and investor presentations.
Pros:
- Access to statistics, forecasts, and dossiers across industries and markets
- Customizable charts and graphs exportable directly for use in presentations and reports
- Frequent data updates ensuring figures reflect current market conditions
- Consumer market data, company revenue data, and industry benchmarks in one place
- Downloads available in PowerPoint, Excel, and PDF formats
Cons:
- Full subscriptions can be expensive, particularly for access to premium dossiers and forecasts
- Some niche industries or emerging markets have limited data coverage
User Rating: 4.4/5 (G2)
Pricing: Individual plan starts at $199/month, billed annually. A free plan is available with access to limited statistics.
Verdict: The go-to when you need a citable number for a deck or report, fast. Hard to justify at full subscription cost for teams that need market data occasionally rather than weekly.
10. Google Trends: Best for Free Trend Spotting
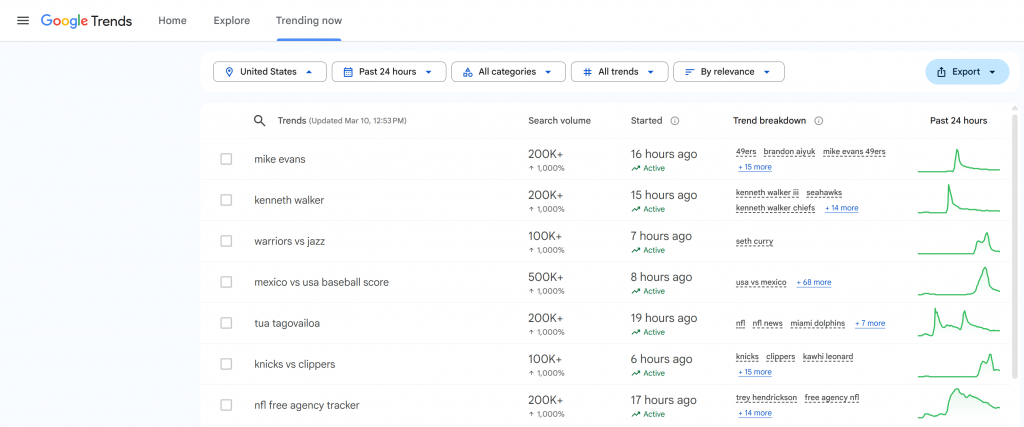
Google Trends has had a permanent tab in my browser for years. It is underestimated precisely because it is free and familiar, but the signal it surfaces is hard to replicate with paid tools.
It shows whether interest in a topic is rising, falling, or seasonal. That is often the only signal you need before deciding whether something is worth pursuing.
Best For: Any team that needs a fast, free read on whether a topic, keyword, or product category is gaining or losing momentum before committing time or budget.
Pros:
- Real-time trend visualization showing the rise and fall of keyword popularity over any time period
- Side-by-side keyword comparison to gauge relative interest across topics
- Geographic breakdown of search interest to inform regional marketing and product decisions
- Related queries and rising topics that expand the understanding of a trend
- Completely free with no account or signup required
Cons:
- Provides relative, not absolute, search volume data, so actual search count estimates are not available
- Limited for deep long-tail keyword research or audience segmentation
User Rating: 4.6/5 (G2)
Pricing: Free for Google Workspace users
Verdict: Run this before any keyword, topic, or product decision. It takes two minutes, and the directional signal it gives is hard to get anywhere else for free. No team should skip it.
What Are My Top 3 Market Research Software Picks?
Running through 10 tools is useful for finding the right fit. But if you are at the start of building a research program and just need to know where to put your time first, here is the short answer.
Pick 1: Qualaroo, Best Overall for In-Product Research
For most product and growth teams, the research gap is not a lack of data. It is a lack of contextual data collected at the right moment. Qualaroo solves that better than anything else at its price point. The forever-free plan means you can validate it without a budget conversation, and the targeting capabilities mean your first survey can reach the exact segment you care about from day one.
Pick 2: Hotjar, Best for Understanding User Behavior
If your primary question is “what are users actually doing on this page or in this flow?”, Hotjar answers it faster than any other tool on this list. The combination of heatmaps and session recordings gives you behavioral evidence that no survey can replicate. It belongs in every product team’s stack.
Pick 3: Similarweb, Best for Competitive Context
Every research program eventually needs an external reference point. How does your traffic compare to competitors? Where are they getting traffic you are not? What keywords are they winning that you are ignoring? Similarweb answers all three without requiring access to anyone’s internal data.
Evaluation Criteria
Most teams evaluate tools based on demo quality and pricing pages. That is a reliable way to end up with software that looks great in a trial and collects dust three months later.
Here is how I evaluated these tools:
| Criterion | What to Look For | Why It Matters | Verdict |
|---|---|---|---|
| Analytics Depth | Patterns and sentiment, not just raw counts | Raw data without interpretation slows decisions down | Must-have. A tool that gives you counts without themes forces you to do the analysis yourself, which most teams never do. |
| Targeting Capabilities | Segment by behavior, page, funnel stage, or user property | Broad surveys produce generic, low-value responses | Must-have. Untargeted surveys are the single biggest reason research produces nothing actionable. |
| Data Accuracy | Real users, quality control, and panel verification | Directionally wrong data is worse than no data at all | Non-negotiable for any study you plan to act on. Directionally wrong data is worse than no data. |
| Ease of Use | Non-developer can launch a study in under 30 minutes | If it needs engineering, most teams will not use it consistently | Critical for small teams. If setup requires a ticket, most research never gets run. |
| Integrations | CRM, Slack, BI tools, and session recorders | Insights that stay inside the tool rarely drive action | Important but not a dealbreaker. Prioritize if your team won't manually export data. |
| Real-time vs. Async | In-the-moment capture vs. scheduled recall | Recall bias degrades data quality within hours of an experience | Underrated. Most teams overlook this until they realize their survey data doesn't match behavior. |
| Pricing Transparency | No hidden credit costs, competitor add-on fees, or usage surcharges | Several tools inflate their real cost significantly at scale | Check this before signing. Several tools on this list cost two to three times their listed price at scale. |
The two criteria most teams ignore until it is too late: real-time vs. async and pricing transparency.
A tool that captures feedback three days after the experience will always produce less accurate data than one that captures it in context. And a tool that adds high costs as you scale can blow your research budget before you realize it.
FREE. All Features. FOREVER!
Try our Forever FREE account with all premium features!
How Do You Build a Market Research Stack That Actually Works?
Three tools used consistently will always outperform ten tools used occasionally. Here is how to think about building a stack that your team will actually run with, rather than abandon after the first quarter.
The most common mistake is trying to find one tool that does everything. That tool does not exist, and chasing it wastes time and money. A lean, effective market research stack needs exactly three layers.
Layer 1: In-Product Survey Tool
This is your qualitative and quantitative backbone. It captures what users think, feel, and intend at the moment they experience your product. Look for in-context triggers, AI-powered sentiment analysis, and direct integrations with your CRM and communication tools.
Layer 2: Behavioral Analytics Tool
This captures what users actually do, regardless of what they say. Heatmaps, session recordings, and funnel analysis fill in the gaps that surveys cannot reach. No one tells you they got confused on step three of your onboarding. Their behavior does.
Layer 3: Competitive Intelligence Source
This gives you external context. Without it, you are optimizing in a vacuum. You need to know where competitors are winning traffic you are not, what keywords they are ranking for, and how your positioning lands relative to what is already in the market.
Matching Your Stack to Your Team:
| Team Size | Research Goal | Recommended Stack |
|---|---|---|
| 1 to 10 people | Validate product assumptions fast | Qualaroo (free) + Google Trends + Hotjar (basic) |
| 10 to 50 people | Ongoing user research + competitive monitoring | Qualaroo + Hotjar + Similarweb |
| 50 to 200 people | Multi-method research + enterprise integrations | Qualaroo + Hotjar + Similarweb + Statista |
| 200+ people | Enterprise-scale programs with advanced analytics | Qualaroo + Hotjar + Similarweb + Statista |
One thing to keep in mind: you do not need to deploy all three layers at once. Start with the layer that answers your most urgent question and build from there.
What Is the Right Market Research Workflow for Your Team?
Tools without a process are just expensive subscriptions. What separates teams that get real value from market research from those who do not is not the quality of their tools. It is whether they have a repeatable sequence that connects data to decisions.
Here is the workflow that works:
- Define the decision, not the topic. Start with “should we redesign the onboarding flow?” not “let’s research onboarding.” A decision forces you to think about what evidence would actually change your mind.
- Choose your research method based on what would move the needle. If you need to understand user intent, use surveys. If you need to see where users get stuck, use behavioral tools. If you need market context, use competitive intelligence. Match the method to the question. And if you are not sure what to ask, start with a proven set of market research questions before you pick a single tool.
- Select the tool that fits the method. Not the other way around. Do not pick Qualtrics because it looks powerful, and then try to make it answer a question it was not built for.
- Collect data in context, at the moment of the experience. The closer you get to the actual user moment, the better your data will be. In-product beats post-session. Post-session beats follow-up email. Follow-up email beats nothing, but only barely.
- Analyze and segment by audience, behavior, or funnel stage. Do not treat your entire user base as a single audience. A new user struggling with onboarding and a power user frustrated by a missing feature need different responses.
- Validate with a second method before acting. If surveys tell you users want Feature X, check behavioral data to see if users are actually using the closest existing feature. If they are not, the stated demand may not reflect real behavior.
- Present insights with context, not just a chart and a score. An NPS of 42 means nothing without the trend, the segment breakdown, and the open-text themes that explain the movement. Give decision-makers the context they need to act.
How Do You Choose the Right Consumer Research Tools for Your Business?
The right tool is not the most popular one or the one with the longest feature list. It is the one that fits the specific decision you are trying to make right now. Use these scenarios to cut through the noise and find your starting point.
| If Your Primary Need Is... | Start With This |
|---|---|
| Real-time in-product feedback without developer dependency | Qualaroo |
| Seeing what users do, not just what they say | Hotjar |
| Competitive traffic, channel mix, and keyword intelligence | Similarweb |
| Enterprise-scale survey research with complex analytics | Qualtrics |
| Validating a product or content idea before building it | AnswerThePublic + Google Trends |
| Statistical data to support a strategy or investor deck | Statista |
One principle applies across all of them: integration fit matters more than feature count. The best market research tool is the one your team will actually use consistently, export data from regularly, and connect to the systems where decisions get made. A powerful tool that lives in a silo produces the same outcome as no tool at all.
Ready to Start Collecting Better Research?
The fastest way to improve your market research is to close the gap between when something happens and when you ask about it. Every day you wait to collect feedback, context fades and recall bias grows.
Start with a tool like Qualaroo and run your first in-product survey without involving a developer. The forever-free plan includes all premium features, targeting capabilities, and AI-powered sentiment analysis.
Or, if you want to see how in-context research works for your specific product, book a demo and walk through a live setup with a research advisor.
Frequently Asked Questions
What sample size do I need for reliable market research?
You need a minimum of 100 responses for statistically significant results in most business contexts. Below that, you have directional signal, not reliable data. For segmentation analysis, plan for at least 100 responses per segment you want to analyze independently.
Can AI replace traditional market research methods?
No, but it makes traditional methods significantly faster. AI tools excel at synthesizing desk research, summarizing qualitative data, and generating synthetic persona responses for early-stage concept testing. Where they consistently fall short is capturing the messy nuance of real human behavior. The standard is AI-assisted research with a human in the loop for interpretation and decision-making.
What is the difference between qualitative and quantitative market research tools?
Quantitative tools collect numerical data at scale: NPS scores, CSAT ratings, and survey response distributions. Qualitative tools capture open-text responses, video sessions, and behavioral observations that explain the numbers. The most effective research programs use both so the score tells you what happened, and the open text tells you why.
How do survey tools compare to behavioral research tools?
Survey tools capture what users say they think, feel, or intend. Behavioral tools capture what users actually do. A user might tell a survey they found the checkout flow easy, while a session recording shows them clicking the wrong button three times. Both signals are real; neither alone gives you the full picture.
Which market research tool is best for validating a product idea before launch?
Qualaroo is the strongest option for in-product concept validation, letting you survey users at the exact moment they encounter a new feature or prototype. For pre-launch consumer interest, AnswerThePublic shows what questions people are already asking in your product category, and Google Trends shows whether that interest is growing.
How often should you run a market research study?
For scheduled customer feedback, once every 90 days per contact is the practical maximum before survey fatigue sets in. For in-product research using behavioral triggers, you can run continuously because surveys appear contextually rather than on a fixed schedule. For competitive intelligence, a monthly review of key metrics is typically enough to stay ahead of meaningful shifts.
FREE. All Features. FOREVER!
Try our Forever FREE account with all premium features!
 We'd love your feedback!
What did you like & how can we make it even better?
 Thanks for your feedback!
 Ask Your Question
Have a question? Get expert help to make your decision easier.