
Customers are the linchpin of success for any business. Their ever-shifting preferences demand vigilant attention.
Imagine this: a bustling online store, carts brimming with potential sales, suddenly abandoned by visitors. What a disappointing situation to be in for a business.
It is where customer satisfaction metrics enter the scene.
Businesses frequently track these metrics because they’re not mere numbers; they’re the roadmaps to customer satisfaction nirvana.
So, let’s look at 11 crucial metrics you need to track to keep your customers happy, loyal, and multiplying.
Here Are All the Customer Satisfaction Metrics You Need
Let’s kick off our discussion with the ‘OG’ metrics:
Customer Satisfaction Score (CSAT)
Understanding the heartbeat of your customers is paramount. That’s precisely where the Customer Satisfaction Score, or CSAT, steps in. It gauges how content your customers are with your product or service.
You can track this CS metric using a simple survey where customers rate their satisfaction on a scale of 1 to 5, 1 to 7, or emoticon ratings. The lowest number signifies discontent, and the highest denotes pure delight.

Net Promoter Score (NPS)
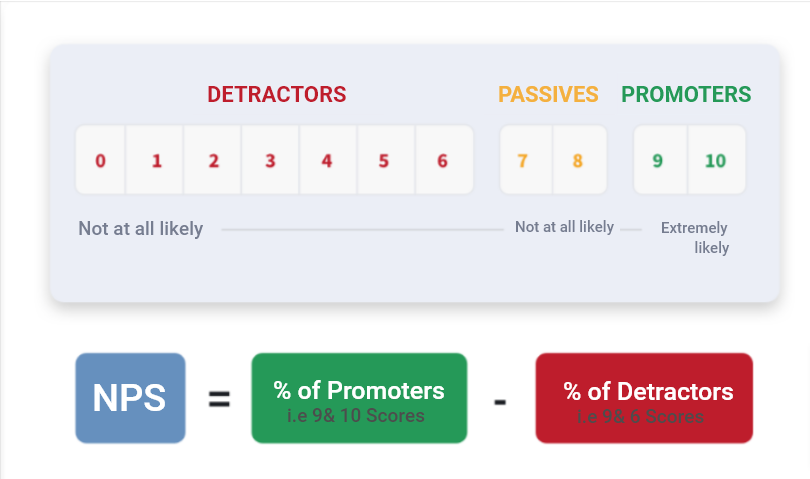
NPS is your compass for navigating the tumultuous seas of customer advocacy. It helps you distinguish brand loyalists from dissatisfied customers. To track NPS, you just need to ask this simple question, “On a scale of 0 to 10, how likely are you to recommend our product or service to a friend or colleague?”
Based on the responses, customers fall into three categories: Promoters (the raving fans), Passives (those sitting on the fence), and Detractors (the unhappy campers).
Read More : Top Net Promoter Score survey (NPS) tools & software 2024 ?
Case Study: Belron
Belron is a prominent player in the automobile windshield industry, operating in the USA and UK. However, windshield repair and replacement aren’t typical occasions for celebration among customers.
As Stephen Payne, Customer Journey Improvement Manager at Belron, notes, “The products that Belron sells are what I call ‘grudge’ purchases. Nobody wakes up and says, ‘I just wonder how much it would cost to get my windshield replaced.’”
Jamie Carter, Voice of the Customer Manager, underscores, “The only way that we can continually provide [the easiest possible] experience is by understanding and internalizing what previous customers have told us.”
To achieve this, Belron integrated NPS (Net Promoter Score) management into their customer satisfaction strategies, enabling them to systematically gather, analyze, and respond to customer insights.
The outcome?
They maintained a high NPS score of 80 while learning valuable lessons from departing customers to enhance their website experience.
Customer Effort Score (CES)
CES measures how much effort customers have to put into their interactions with your brand. Consider it a straightforward survey where customers rate their experience on a scale from “Effortless” to “Challenging.”
CES is the go-to metric when you want to analyze the ease or difficulty customers face during specific journeys. It helps pinpoint where the process is smooth and where it’s cumbersome.
CES isn’t just about identifying roadblocks; it’s your strategic tool for optimizing experiences and ensuring customers enjoy a frictionless path with your brand.
| Our CSAT vs. NPS vs. CES blog covers these three juggernaut metrics in great detail. After reading this article, you can check it out to start tracking these customer experience metrics. |
Abandonment Rate
B2C e-commerce businesses face shopping cart abandonment all the time.
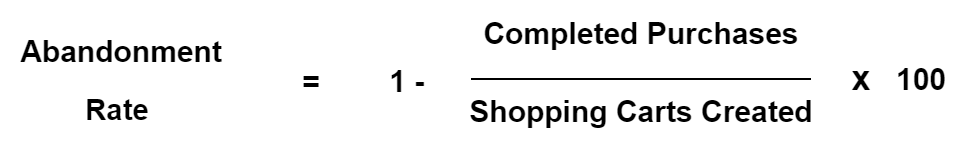
The abandonment rate is the percentage of customers who leave the checkout process mid-way without completing the purchase.
Cart abandonment directly impacts your revenue and customer acquisition cost. You just lost a customer at the cusp of conversion.
Coming to the average rate, based on the data calculated by Baymard Institute, the average cart abandonment rate stands at 70.19%.
With that covered, let’s move on to – how does it work?
In cart abandonment, customers spend time on your website, selecting products, and adding them to the cart, but something makes them abandon your products altogether.
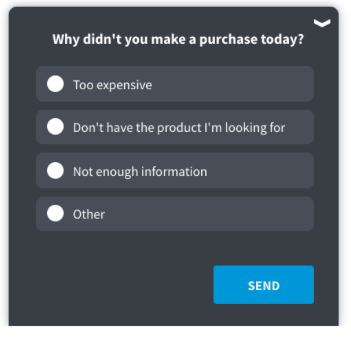
So, to reduce the abandonment rate, you can directly ask customers about the reason for abandonment using exit-intent pop-up surveys.
There are many possible reasons for this unfortunate event, such as unoptimized product pages, long checkout process, unclear pricing or shipping policy, etc.
Here are a few more questions you can ask in your cart abandonment survey:
- “Was there anything about this checkout process that we should improve?”
- “Is there anything preventing you from completing your purchase?”
- “Why didn’t you make a purchase today?”
- “What is missing on the page that made you leave without purchasing?”
- “What stopped the user from completing an action?”
- “If you don’t plan to make a purchase, can you tell us why not?”
You can deploy exit-intent surveys when the customers are about to leave the website. You can trigger popup surveys with a survey feedback and customer experience measurement tool like Qualaroo when the customers move their cursor closer to the close tab.
This way, you can ask the customers why they did not complete the purchase so you can resolve their issues in real-time and stop them from churning.
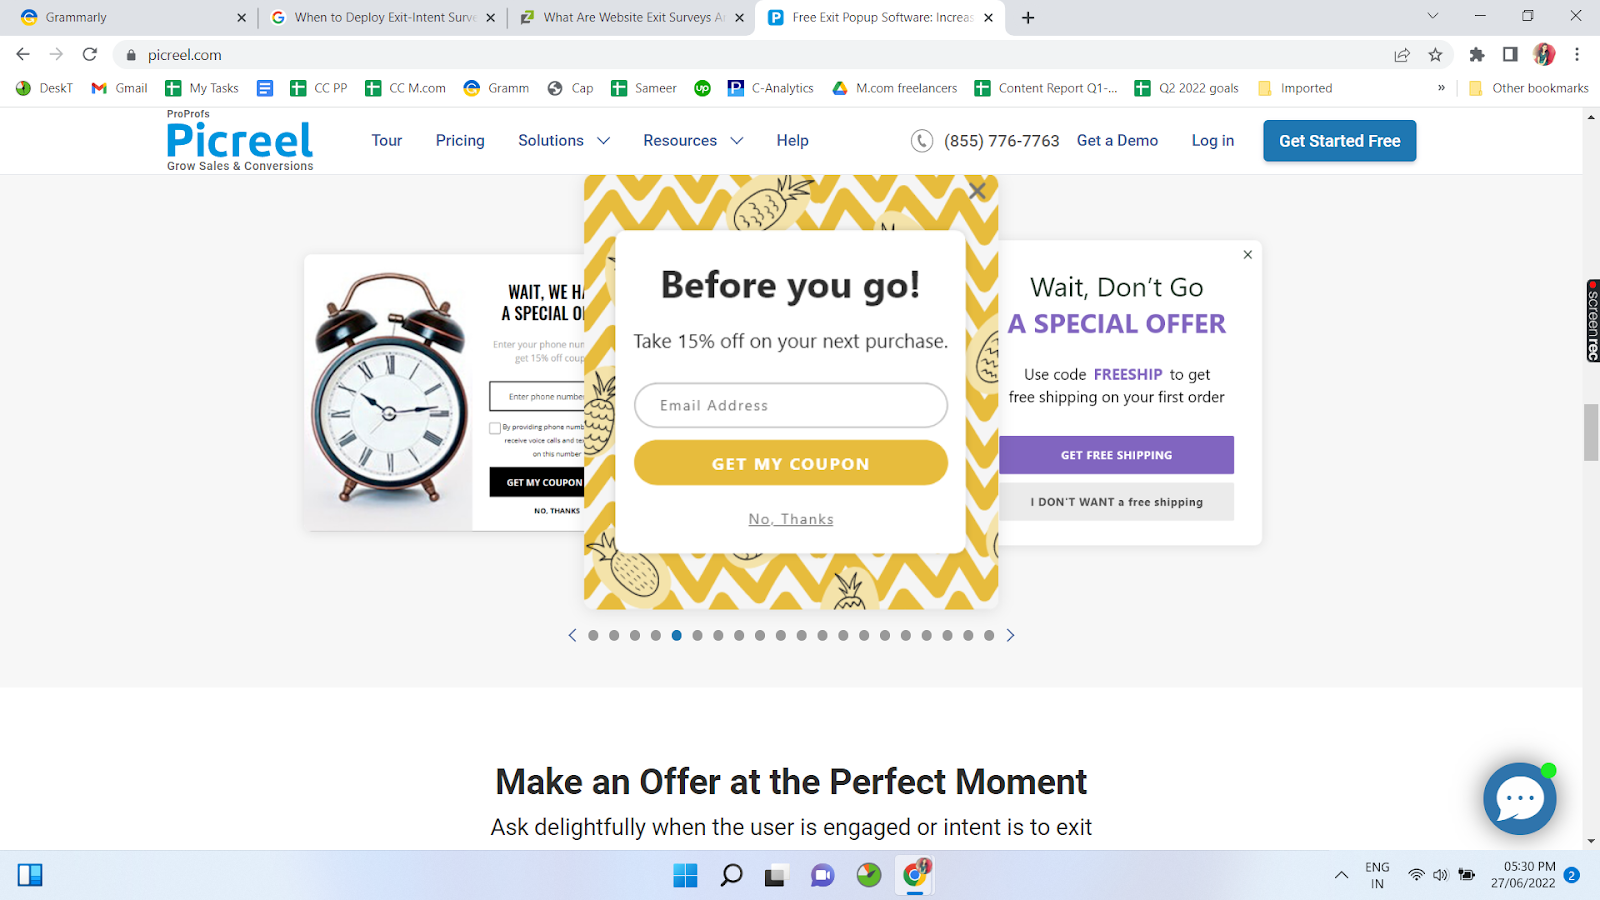
You can even use an exit intent software like Picreel to offer discounts or offers via popups and overlays:
Businesses analyze and periodically calculate this customer experience metric to track the impact of abandonment. The higher the rate, the more unsatisfied customers your business has, and vice versa.
So, to improve your overall customer experience, you need to lower your abandonment rate.
Here’s how you can calculate it:
For example, say you made 5,000 sales in a month, and the number of shopping carts created that month was 23,500.
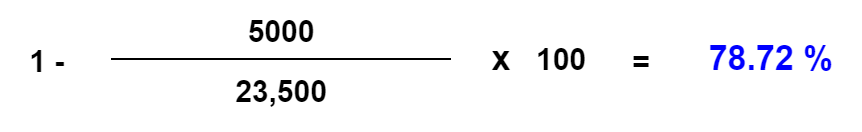
So, according to the formula above, the abandonment rate is 78.72%.
First Response Time (FRT)
FRT is the time taken by a company to respond to customers who reach out via different channels such as live chat, email, social media, etc., to get their issues resolved.
But why is this customer experience metric so significant?
Because the more the customers have to wait for a company’s response, the more their experience is hampered.
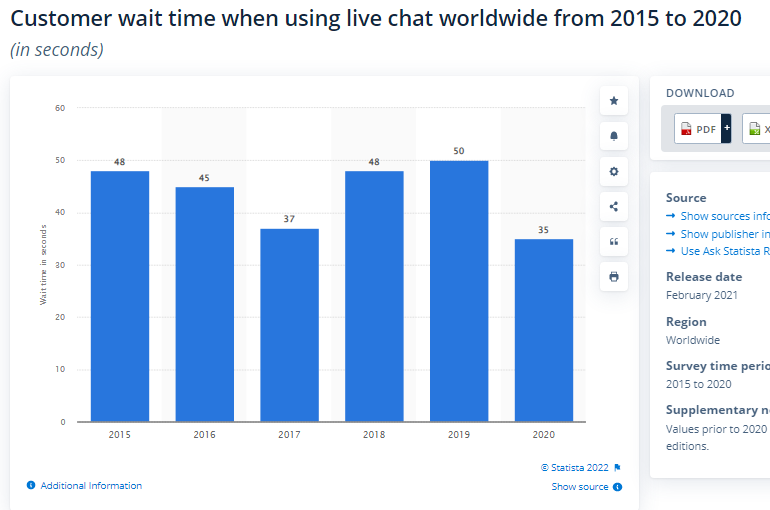
First Response Time varies from platform to platform. For example, a good FRT for live chat is 35 seconds or less; for social media, it is anytime on the same day customers reach out; for emails, it is 30 minutes or less.
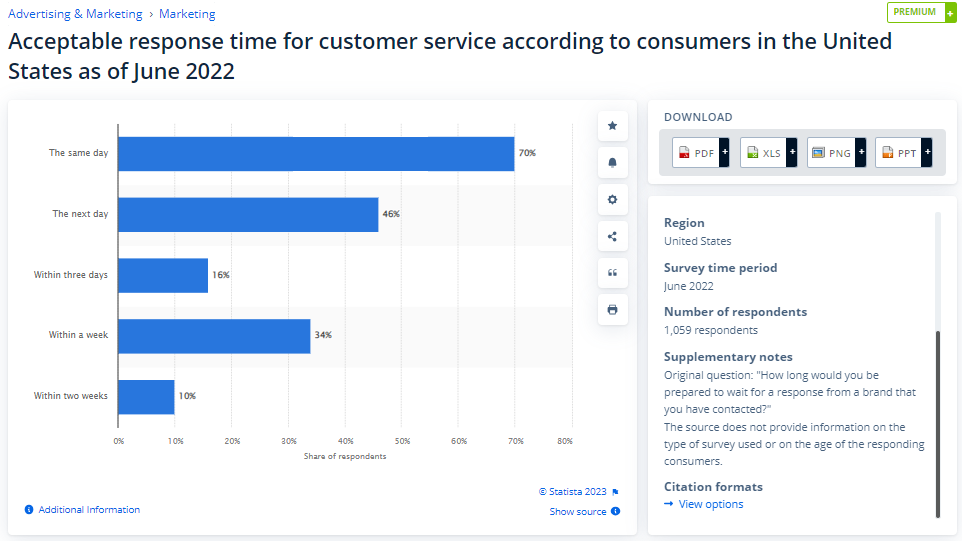
FRT focuses on how fast a customer gets a response from the company regarding their issues or tickets.
As you can see in the graph below, the wait time for customers on live chat hit the ultimate low at 35 seconds in 2020. This gradual decrease in wait time shows how much companies spend on giving the best customer experience with shorter wait times.
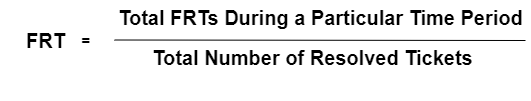
So, how do you calculate FRT?
While calculating First Response Time, companies analyze their interactions across different channels and then compare them to resolved tickets. Here’s the formula:
Let’s understand this better with an example.
Suppose you resolved 1000 tickets in June and the time taken for the first response was 25,000 seconds. Then, the average FRT will be:

First Contact Resolution (FCR)
The First Contact Resolution metric gauges the percentage of service request calls resolved in the first interaction. There is no follow-up or second interaction required.
So, what is the importance of measuring this customer satisfaction metric?
It is a crucial driver of customer satisfaction. The higher the score, the higher the level of satisfaction. According to a study, the average FCR for service desks globally is 74%.
You can measure FCR along with other metrics such as Average Handle Time, which gauges the time support agents spend on each call. A fast average talk time and a low FCR indicate low customer satisfaction.
Additionally, a low FCR means more follow-ups and second interactions, which requires more support personnel to take the calls.
Either the customers hang up the call before the agent can provide the resolution, or the team members cannot resolve the queries over the first call (insufficient product knowledge).
Now, there is a simple way to reduce the burden on your support agents. You can leverage a knowledge base software so that customers can resolve small queries on their own.
You can use this formula to calculate FCR on calls and tickets issued as well.
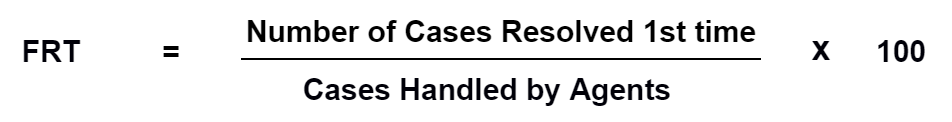
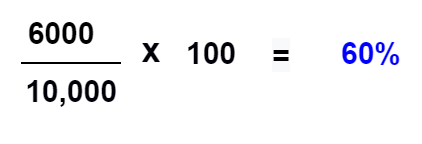
For example, if you get 10,000 calls and resolve 6,000 in the first interaction. Then your FCR for calls will be:
Also read: 20 Proven Tips to Improve Customer Satisfaction in 2024
Value Enhancement Score (VES)
Gartner’s newest customer satisfaction metric, VES, gauges customers’ perceptions and views of products and services. This metric is a great way to boost customer loyalty and retention.
Value Enhancement Score focuses on:
- How the service interaction quality impacts consumers’ ability to use the services/products.
- How the service interaction affects customers’ confidence in the decision to buy products/services.
Gartner recorded the average VES of 3.96 in their study with 2000 customers.
Gartner’s report shows that increased positive feeling of customers toward products/services also increases their perceived value.
As a result, customers are more inclined to purchase again, spread positive word of mouth, and increase their spending limit on a brand’s products/services.
You can use this customer experience metric in different ways as follows:
- Identify the most nurturing and conducive interactions to increase customer loyalty.
- Predict customer behavior based on the interactions.
- Identify your most-skilled support representatives.
- Track individual VES to gauge each customer’s loyalty.
You can deploy VES surveys after customers interact with your support personnel or use your customer support services like live chat, knowledge base, etc.
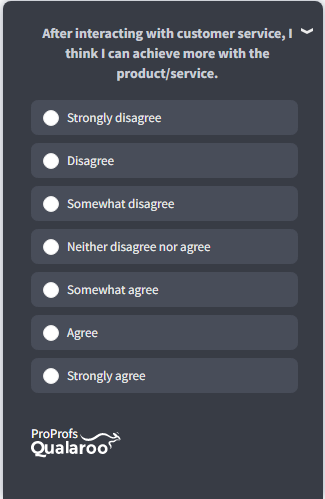
To calculate VES, you need to ask two questions after your customers have made the purchase.
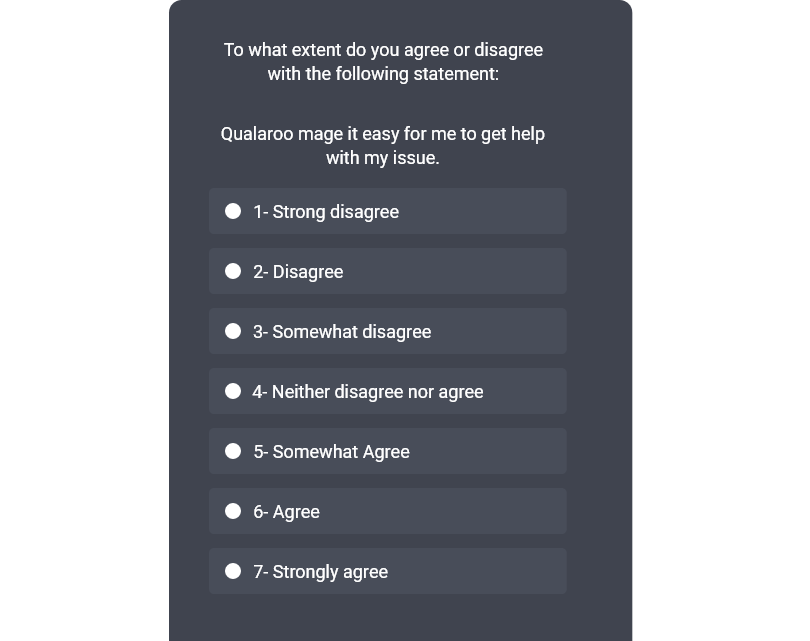
These questions are recorded on a 7-point Likert scale and gauge whether or not the service interaction helped customers achieve more with the product, i.e., whether they perceive the product/service to be more valuable.
The higher the total VES, the higher the value customers place on your products/services.
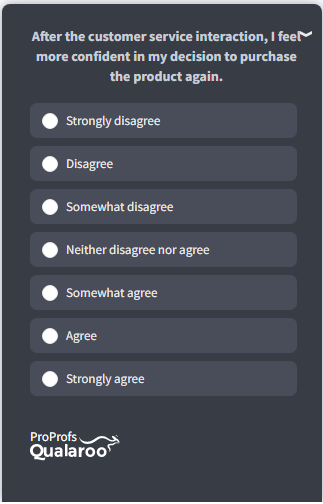
Here are the two questions you can ask to gauge VES using surveys:
- After interacting with customer service, I think I can achieve more with the product/service.
- After the customer service interaction, I feel more confident in my decision to purchase the product again.
Customer Service Satisfaction (CSS)
As the name suggests, this metric gauges the level of satisfaction a customer gets after a particular interaction with your support personnel. It is used as a post-purchase metric to understand if they find the product or services as good as it was claimed to be.
You can collect CSS feedback every time a customer reacts with your business to keep tabs on how helpful and effective your customer support is. It is an ongoing process and does not require additional efforts every time you collect feedback once it is properly set up.
You can integrate CSS in any type of communication channels such as live chat, pop-ups, video chat support, forms, online surveys, and others.
You can ask more than one question, depending on what type of feedback you want to collect. Emoticons ratings or rating in general also works amazingly well for CSS surveys, followed by an open-ended question to understand why customers gave a low rating.
It is to be noted that CSS only helps gather feedback for a single interaction and does not paint the whole picture.
Customer Health Score (CHS)
Unlike other survey metrics, Customer Health Score is more of a process that aims to analyze customer behavior to determine their score or leaving or staying in your business.
CHS metric observes each customer’s behavior and assigns them a score based on the analysis to categorize them as promoters and detractors. It helps businesses take preventive measures to lower the churn rate and increase the retention rate.
The question is – What factors are measured in the CHS metric to evaluate the score?
Among many, the most crucial parameters to analyze are – How frequently customers use your product, what they prefer more between premium and free versions, how many products they use from your brand, frequency of contacting customer support, amount of purchases, and so on.
Since each business is unique in its own way, the parameters may change a little bit. However, what remains constant is grouping customers into three categories: healthy (going to stay), at-risk of leaving, and poor (decided to leave).
This metric helps businesses take proactive measures since they can see which customer is at risk by analyzing their declining engagement and behavior.
Customer Churn Rate (CCR)
Customer Churn Rate aims at examining the rate at which customers stop engaging with your business. A high rate signifies that customers who are not satisfied with your services or products are leaving.
If you experience a high churn rate, it is time to introspect and find the bottlenecks and resolve their issues to prevent the rate from increasing further.
Here is how you can calculate the CCR –
CCR = Number of clients at the starting of a quarter – number of clients at the end of a quarter
Number of clients at the starting of a quarter
Online ratings/reviews
Another metric to understand how successful your services and products are among customers is to analyze online reviews and customer ratings. The best thing for this is to allow your customers to review and rate your services or products after a while, i.e., they have had a chance to experience them.
You can also track reviews and ratings related to your products on many forums such as Yelp and Reddit.
Here is how you can calculate average ratings –
Average Ratings (AR) = 1*a+2*b+3*c+4*d+5*e/5
Here, numbers (1,2,3,4,5) signify the ratings and alphabets (a,b,c,d,e) are the number of ratings.
Set SMART Goals With a Combination of Customer Experience Metrics
These customer satisfaction metrics are crucial in helping businesses get closer to the ground reality of their brand experience and how users feel about their services/products.
You can start with one metric, but don’t stop there. Analyze where you stand with your objectives, set smart goals, and then assemble the combination of customer satisfaction metrics that align with your business objectives.
If you want to get started immediately, you can use a survey feedback tool like Qualaroo that helps you track all these metrics using non-intrusive, pop-up surveys on different platforms.
You’ll be able to efficiently collect and analyze customer satisfaction metrics to know their customers and offer delightful experiences.
Learn More About Customer Satisfaction Metrics
1. What Are Customer Satisfaction Metrics?
Customer satisfaction metrics are quantitative and qualitative measurements used to assess how satisfied customers are with a product, service, or overall brand experience.
These metrics provide valuable insights into customer opinions and perceptions, helping businesses gauge and improve customer satisfaction levels.
2. What are the 7 different ways to measure customer satisfaction?
Seven common methods to measure customer satisfaction include Customer Satisfaction Score (CSAT), Net Promoter Score (NPS), Customer Effort Score (CES), Online Reviews and Ratings, First Response Time (FRT), Customer Churn Rate (CCR), and Customer Service Satisfaction (CSS).
3. What is KPI for customer service satisfaction?
Key Performance Indicators (KPIs) for customer service satisfaction may include metrics like First Response Time (FRT), Average Handling Time (AHT), Net Promoter Score (NPS), Customer Effort Score (CES), and Customer Satisfaction Score (CSAT). These KPIs help businesses assess and improve the quality of their customer service.
4. What are the important 6 techniques for measuring customer satisfaction?
Six essential techniques for measuring customer satisfaction are surveys and questionnaires, feedback forms, social media monitoring, online reviews and ratings analysis, customer interviews and focus groups, analyzing customer complaints and support tickets. These methods provide comprehensive insights into customer sentiments and areas for improvement.
5. What are the challenges with customer satisfaction metrics?
These are a few challenges with customer satisfaction metrics:
- Interpretation can be subjective, as a high score doesn’t guarantee loyalty.
- Biases can skew results; vocally unhappy customers may dominate feedback.
- Consistently collecting data can be challenging, especially in rapidly changing industries.
- The right metric selection is crucial, as using too many can overwhelm and confuse both customers and teams.
- These metrics can’t always capture the emotional aspect of satisfaction, leaving nuanced feedback unaddressed. For this, you need to use sentiment analysis along with surveys to see the full picture.
Frequently Asked Questions
What are the 7 different ways to measure customer satisfaction?
Seven common methods to measure customer satisfaction include Customer Satisfaction Score (CSAT), Net Promoter Score (NPS), Customer Effort Score (CES), Online Reviews and Ratings, First Response Time (FRT), Customer Churn Rate (CCR), and Customer Service Satisfaction (CSS).
What is KPI for customer service satisfaction?
Key Performance Indicators (KPIs) for customer service satisfaction may include metrics like First Response Time (FRT), Average Handling Time (AHT), Net Promoter Score (NPS), Customer Effort Score (CES), and Customer Satisfaction Score (CSAT). These KPIs help businesses assess and improve the quality of their customer service.
What are the important 6 techniques for measuring customer satisfaction?
Six essential techniques for measuring customer satisfaction are surveys and questionnaires, feedback forms, social media monitoring, online reviews and ratings analysis, customer interviews and focus groups, analyzing customer complaints and support tickets. These methods provide comprehensive insights into customer sentiments and areas for improvement.
What are the challenges with customer satisfaction metrics?
These are a few challenges with customer satisfaction metrics:
- Interpretation can be subjective, as a high score doesn't guarantee loyalty.
- Biases can skew results; vocally unhappy customers may dominate feedback.
- Consistently collecting data can be challenging, especially in rapidly changing industries.
- The right metric selection is crucial, as using too many can overwhelm and confuse both customers and teams.
- These metrics can't always capture the emotional aspect of satisfaction, leaving nuanced feedback unaddressed. For this, you need to use sentiment analysis along with surveys to see the full picture.
Want insights that improve experience & conversions?
Capture customer feedback to improve customer experience & grow conversions.